Open Access
Fig. 2.
Download original image
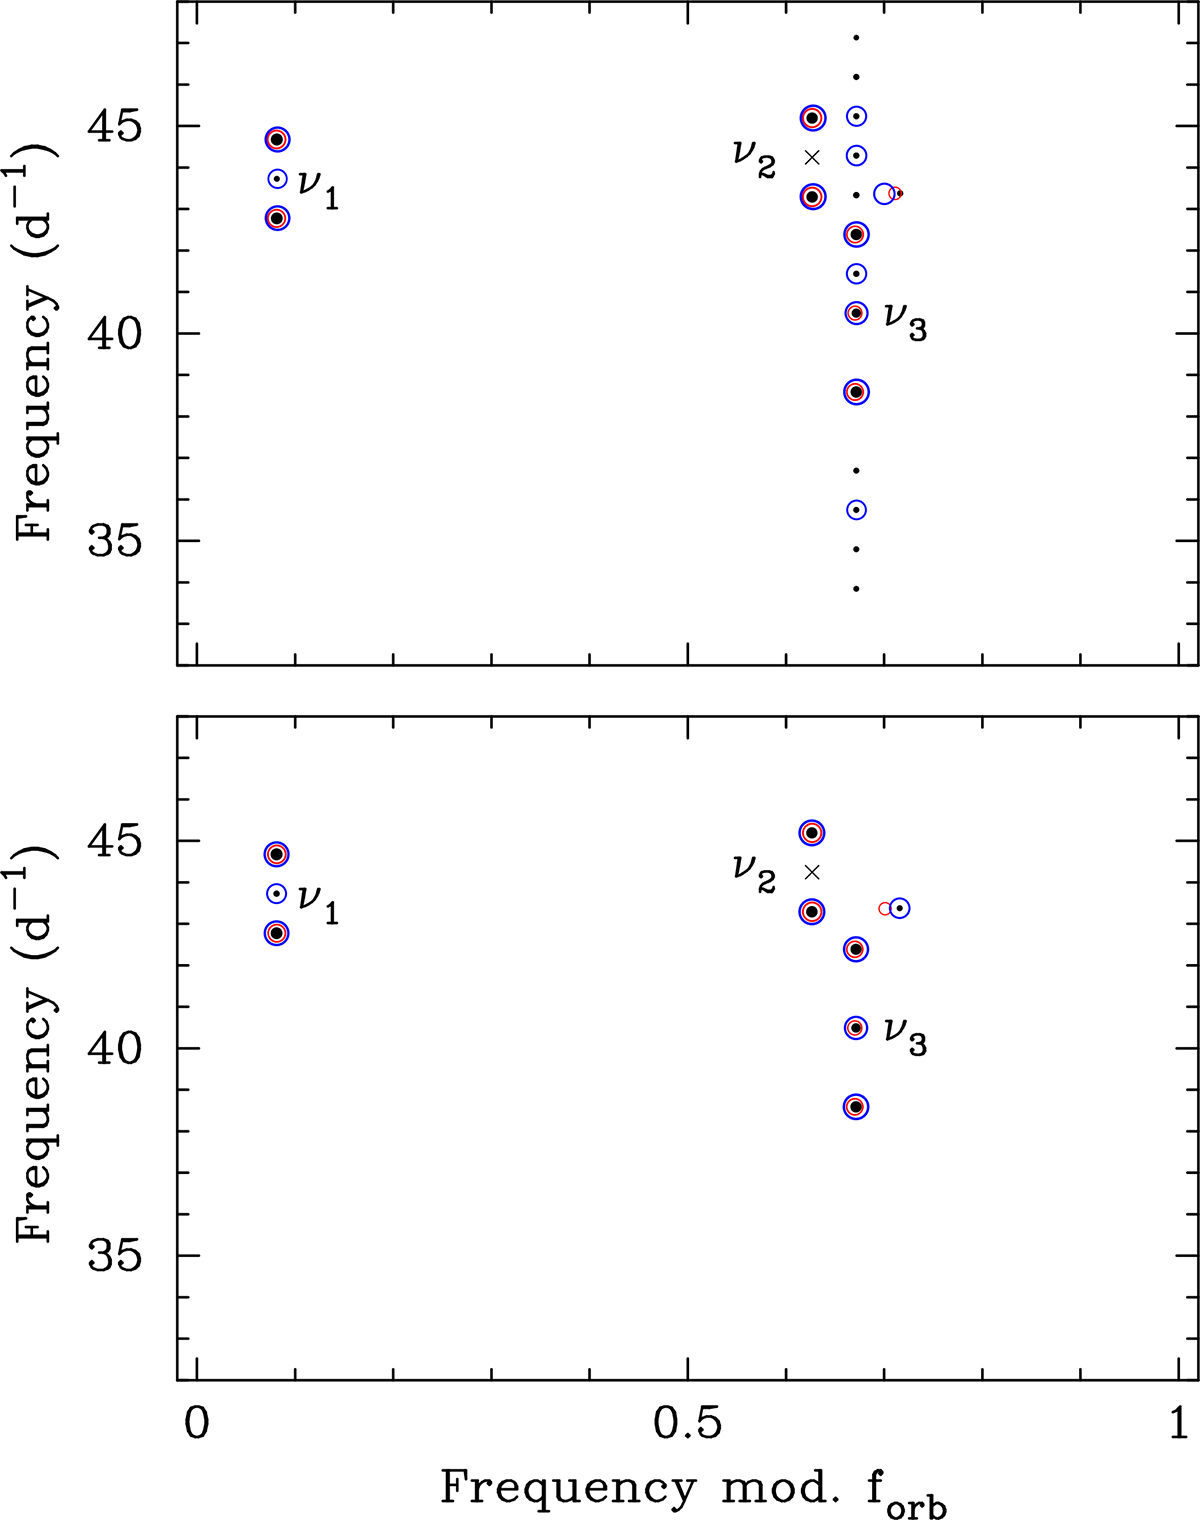
Échelle diagram for EL CMi from Sectors 34 (black), 61 (red), and 88 (blue). Top: All data. Bottom: Primary eclipses removed from the light curve. The sizes of the plot symbols relate to the logarithm of the pulsation amplitude; the cross marks the expected location of the centroid of mode ν2.
Current usage metrics show cumulative count of Article Views (full-text article views including HTML views, PDF and ePub downloads, according to the available data) and Abstracts Views on Vision4Press platform.
Data correspond to usage on the plateform after 2015. The current usage metrics is available 48-96 hours after online publication and is updated daily on week days.
Initial download of the metrics may take a while.