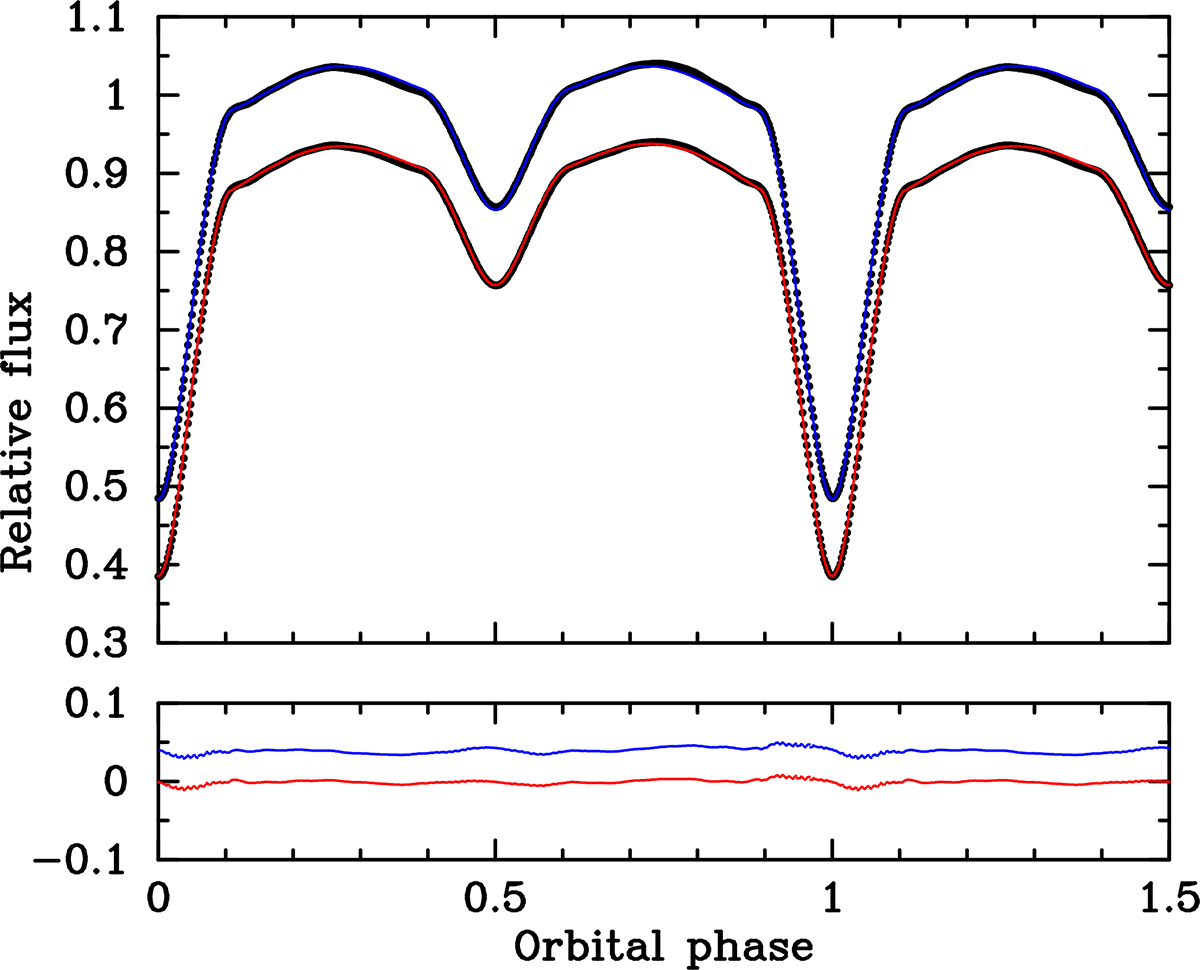
Fig. 7.
Download original image
Upper panel: Fit to the phase-binned TESS PDC light curve from Sector 34 (black points) compared to the fit derived with PHOEBE2 (blue line) and the combined SED + light-curve fitting approach (red line, data and fit shifted by 10% in intensity for clarity). Lower panel: Residuals from these fits. Blue: PHOEBE2, and red: SED + light-curve fitting, shifted by 4% in intensity for clarity.
Current usage metrics show cumulative count of Article Views (full-text article views including HTML views, PDF and ePub downloads, according to the available data) and Abstracts Views on Vision4Press platform.
Data correspond to usage on the plateform after 2015. The current usage metrics is available 48-96 hours after online publication and is updated daily on week days.
Initial download of the metrics may take a while.