Open Access
Fig. 8.
Download original image
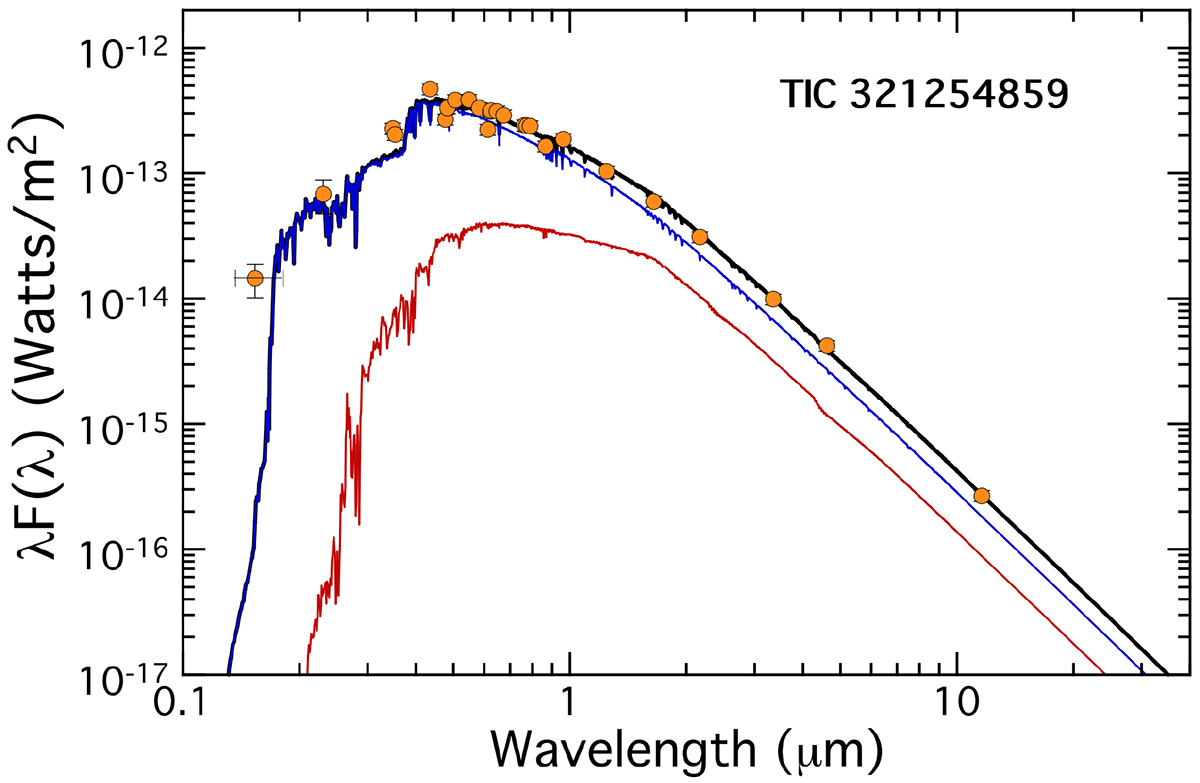
Fit to the SED of the EL CMi system. The orange dots with the error bars show the observational values. The blue line is the SED of the primary star, the red line shows the SED of the secondary, and the black line shows the sum of the two.
Current usage metrics show cumulative count of Article Views (full-text article views including HTML views, PDF and ePub downloads, according to the available data) and Abstracts Views on Vision4Press platform.
Data correspond to usage on the plateform after 2015. The current usage metrics is available 48-96 hours after online publication and is updated daily on week days.
Initial download of the metrics may take a while.