| Issue |
A&A
Volume 702, October 2025
|
|
|---|---|---|
| Article Number | L16 | |
| Number of page(s) | 4 | |
| Section | Letters to the Editor | |
| DOI | https://doi.org/10.1051/0004-6361/202556163 | |
| Published online | 20 October 2025 | |
Letter to the Editor
Spectropolarimetry of NGC 1275 reveals a narrow-line radio galaxy with polarization parallel to its radio jet axis
1
Université de Strasbourg, CNRS, Observatoire Astronomique de Strasbourg, UMR 7550, 11 Rue de l’Université, 67000 Strasbourg, France
2
Nordic Optical Telescope, Apartado 474, E-38700 Santa Cruz de La Palma, Santa Cruz de Tenerife, Spain
3
Department of Physics and Astronomy, Aarhus University, Munkegade 120, DK-8000 Aarhus C, Denmark
4
Institute of Astrophysics, Foundation for Research and Technology – Hellas, Voutes, 7110 Heraklion, Greece
5
Max-Planck-Institut für Radioastronomie, Auf dem Hügel 69, D-53121 Bonn, Germany
6
Department of Physics and Astronomy, University of Turku, Vesilinnantie 5, Turku FI-20014, Finland
7
Institut d’Astrophysique et de Géophysique, Université de Liège, Allée du 6 Août 19c, B5c, 4000 Liège, Belgium
8
Finnish Centre for Astronomy with ESO (FINCA), University of Turku, FI-20014 Turku, Finland
9
Aalto University Metsähovi Radio Observatory, Metsähovintie 114, 02540 Kylmälä, Finland
⋆ Corresponding author: This email address is being protected from spambots. You need JavaScript enabled to view it.
Received:
29
June
2025
Accepted:
7
October
2025
Abstract
Concomitant with the Imaging X-ray Polarimetry Explorer (IXPE) observation of the Perseus cluster, we obtained optical spectropolarimetry of its central active galactic nucleus, NGC 1275, using the Alhambra Faint Object Spectrograph and Camera (ALFOSC) on the Nordic Optical Telescope (NOT). While the total-light spectrum confirms its edge-on, core obscured (type-2) classification, the polarized spectrum shows a polarization angle aligned with the arcsecond radio jet axis – an exceptional behavior for type-2 objects. Our polarization analysis also reveals wavelength-dependent linear polarization at a level of 2−3% in the continuum, likely arising from a combination of variable synchrotron emission and scattering; this supports a narrow-line radio galaxy classification with characteristics of a jet-dominated source.
Key words: black hole physics / polarization / techniques: polarimetric / galaxies: active / galaxies: evolution / galaxies: Seyfert
© The Authors 2025
 Open Access article, published by EDP Sciences, under the terms of the Creative Commons Attribution License (https://creativecommons.org/licenses/by/4.0), which permits unrestricted use, distribution, and reproduction in any medium, provided the original work is properly cited.
This article is published in open access under the Subscribe to Open model. This email address is being protected from spambots. You need JavaScript enabled to view it. to support open access publication.
1. Introduction
Of the high-density regions of the nearby Universe, the Perseus cluster (situated at about 71 Mpc from us; Aguerri et al. 2020) is arguably one of the most extensively investigated. Belonging to the Perseus-Pisces supercluster, a large-scale structure in the southern sky extending about 48 Mpc in projected distance (Chincarini et al. 1983), the Perseus cluster contains one of the most remarkable known core-cooling flows. This flow is closely associated with the central type-D giant elliptical galaxy NGC 1275 and its active galactic nucleus (AGN; see Conselice et al. 2001). At z = 0.017670, NGC 1275’s spatial scale is thus 358 pc arcsec−1, with H0 = 70 km s−1 Mpc−1 (Wilman et al. 2005).
Due to its strong and narrow line emission, filamentary structures, blue color, and nuclear activity, NGC 1275 was first classified as an edge-on, obscured (type-2) Seyfert galaxy (Veron 1978), but this classification is debatable for many reasons: radio-quiet AGNs are typically spiral galaxies and are rarely found at the centers of dense galaxy clusters (Best et al. 2007). In addition, based on its ∼5−37 GHz radio flux densities (10−60 Jy between 1965 and 2022; Paraschos et al. 2023), it should instead be classified as a narrow-line radio galaxy, i.e., the radio-loud counterpart of a Seyfert-2 galaxy. Finally, NGC 1275 also shows variability in both optical and radio polarization, and based on this it could be classified as a “misdirected BL Lacertae type object”, i.e., a radio galaxy whose jet is not aligned close to our line of sight (Antonucci 1993). Indeed, NGC 1275 is the source of highly variable, powerful radiation that is relatively bright in the radio (Paraschos et al. 2023), X-rays (Churazov et al. 2003), and γ-rays (Abdo et al. 2009). While the radio emission comes from nonthermal mechanisms and the optical counterpart is probably a mix of synchrotron emission (from the jet) and thermal emission (from the accretion disk and stars), the origin of high-energy radiation remains unsolved.
This is the reason why NGC 1275 was the target of a deep X-ray polarimetric investigation by the Imaging X-ray Polarimetry Explorer (IXPE). The aim was to simulatenously assess the complex structure of the surrounding intracluster medium and the AGN high-energy emission mechanisms. This was possible thanks to the relatively large field of view of the detector units (about 12.9 arcmin2) and IXPE’s angular resolution (≤28 arcsec; Weisskopf et al. 2022). IXPE observed the Perseus cluster for a total of approximately 2.5 Ms between January 26 and March 26, 2025. The results for the central AGN, observed simultaneously in X-ray, R-band, and radio polarimetry, are presented in Liodakis et al. (2025).
In this accompanying paper, we report on an optical spectropolarimetric observation of the same target, acquired during the last days of the IXPE observation. This is the first polarized spectrum ever published for this target, and it led to the discovery of a unique orientation of the polarization position angle with respect to the parsec-scale radio jet of NGC 1275. As these results provide crucial context for the ongoing analysis of the deeper IXPE observations of the Perseus cluster, we consider it important to report them promptly.
2. Observations
Spectropolarimetry of NGC 1275 (3C 84) was obtained on March 21, 2025, using the Alhambra Faint Object Spectrograph and Camera (ALFOSC) mounted on the Nordic Optical Telescope (NOT). Conditions were clear, with 1.5″ seeing and an airmass of ∼1.3, meaning wavelength-dependent flux losses were minimized. The ALFOSC spectropolarimetry setup uses a rotating λ/2 retarder plate, a 1.5″-wide, 15″-long slit aligned with the parallactic angle to minimize slit losses, a calcite block, and grism #19. This grism covers 4400−6950 Å with 1.2 Å/pixel dispersion and a spectral resolution of 970 at 5640 Å (for a 1″ slit). The retarder plate was rotated in 22.5° steps over four angles, with 90-second exposures per step (total 360 seconds). Data were reduced with the Python pipeline PypeIt (Prochaska et al. 2020). Due to ALFOSC’s design, the Wollaston prism’s left and right beams have slightly offset wavelength zero points. One-dimensional spectra at waveplate angles (α) of 0°, 22.5°, 45°, and 67.5° were corrected for this and re-binned to a common wavelength scale.
From these, we computed the normalized flux differences for each angle and derived the Stokes parameters Q and U using standard formulas, namely  and
and  , where fα = −(Ibeam1 − Ibeam2)/(Ibeam1 + Ibeam2) for each waveplate angle (α). The total intensity spectrum (I) was computed as the sum of all beams. The Q and U spectra were divided by I, resulting in the normalized Stokes parameters u and q. Errors on I, u, and q were then computed from the square roots of the spectra (in electron units) and propagated. We computed the linear polarization degree (
 ) and polarization angle (
 ) using the standard formulas. P and θ were finally corrected for the wave plate chromatic dependence following the NOT guidelines.
Unpolarized (HD154892; Turnshek et al. 1990) and highly polarized (HD161056; Piirola et al. 2021) standard stars were observed shortly after NGC 1275, which confirmed that the instrumental polarization was below 0.1%. Their measured values agreed with the tabulated ones within the uncertainties (Piirola et al. 2020). Interstellar polarization (ISP) in the direction of the center of the Perseus cluster is low, below 0.2%, with position-dependent polarization angles (Panopoulou et al. 2025). Because the polarization we are about to report exceeds 1% in all spectral bins, no ISP correction was deemed necessary.
3. Analysis
We report in Fig. 1 our NOT/ALFOSC spectropolarimetric observation of NGC 1275. At rest wavelengths, the total flux spectrum extends from 4320 to 6824 Å. It has a modest S/N (median S/N across the spectrum of ∼36) and is shown at a spectral resolution of ∼1.2 Å. The polarization signal is noisier, and thus the normalized Stokes parameters are only estimates of their true value. To correct this bias, in the following we use the improved estimator of the polarization degree, the de-biased polarization degree, given by  (Simmons & Stewart 1985). In the graphs, Pd has been re-binned so that each resolution element has Pd/σP ≫ 7.
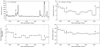 |
Fig. 1. NGC 1275 as observed with NOT/ALFOSC on March 21, 2025. Top left: Total flux spectrum (corrected for instrumental response, in arbitrary units). Top right: Polarized flux (total flux multiplied by the polarization degree). Bottom left: Linear polarization degree (Pd). Bottom right: Polarization position angle (θ). All but the total flux spectrum were re-binned to 137 consecutive pixels (∼237 Å), with observational errors indicated per spectral bin. |
3.1. Spectroscopy
Focusing on the total flux only (see Fig. 1, top left), we see that the spectrum of NGC 1275 is characterized by a monotonic continuum (not corrected for the host galaxy starlight nor reddening) and bright, apparently narrow, nuclear emission lines. Such a spectrum is archetypal of type-2 AGNs, where the central engine (i.e., the supermassive black hole), its accretion structure, and the broad emission line region (BLR), is hidden behind an optically thick veil of dust and gas (Antonucci 1993). This spectrum is not surprising, as it was already presented by Kennicutt (1992). However, a quantitative comparison of the 3650−7100 Å spectrum presented in Kennicutt (1992) with ours is not straightforward as the authors used a 2.5″-wide slit in drift scans along the major axis of the galaxy, with scan lengths of 45″ − 800″, thereby integrating a large fraction of the host galaxy and extended filaments. This explains why their spectrum includes spatially offset narrow-line components, which produce multi-peak [O III] or Hβ profiles if different filaments have different velocities, which do not appear in our observation.
To push the investigation further, we fitted the emission lines with Lorentzian profiles after subtracting the continuum. They are slightly better suited than Gaussian profiles in the case of AGNs, but the two line profiles are largely interchangeable. The results of our fits are listed in Table 1. Focusing first on the Hα/Hβ ratio – which is an indicator of the reddening toward NGC 1275 – we find a value of approximately 3.9. This ratio is significantly higher than the Case B recombination value of ∼2.86, indicating moderate reddening. Using the Fitzpatrick extinction law (Fitzpatrick 1999) and assuming an intrinsic Hα/Hβ of 2.86, this corresponds to a color excess, E(B − V), of ∼0.34. However, since no spectrophotometric calibration was applied and the spectrum could be affected by atmospheric extinction, this estimate as well as those in the following paragraphs should be regarded as indicative rather than precise.
Emission line (rest-frame air wavelengths) properties.
Looking at the widths of the emission lines, we find that almost all of them are smaller than 1000 km s−1, as expected for Seyfert-2 and narrow-line radio galaxies (Netzer 1990). Hα and Hβ have consistent full widths at half maximum (FWHMs), indicating that they are originating from the same emission region. The fact that the two [O III] lines have a FWHM greater than 1000 km s−1 is unusual, but this may be due the jet–cloud interactions or intrinsic emission of the cluster’s complex network of ionized filaments that encompass the central galaxy (Conselice et al. 2001; Rhea et al. 2025). Interestingly, Goodrich (1992) found a similar value for the [O III] doublet (1291 km s−1). Overall, the heterogeneity of the FWHM values suggests a mixture of regions within our integration aperture, some very close to the core and others within the narrow line region (NLR).
The integrated line flux ratios [O III] λ5007/Hβ (∼3.3), [N II] λ6583/Hα (∼0.5), ([S II] λ6696 + λ6756)/Hα (∼0.2), and [O I] λ6300/Hα (∼0.3) are consistent with a Seyfert nucleus (Baldwin et al. 1981) showing signs of high excitation and possibly fast shocks (e.g., [O I]/Hα > 0.1), as also suggested by the weak shock fronts propagating outward from the inner part of Perseus detected by Fabian et al. (2003). However, we note that these line ratios were derived from long-slit spectra, which are subject to several limitations. In particular, the slit orientation, the extraction aperture, and the relatively wide slit likely include emission from physically distinct regions, such that the integrated spectrum may mix gas with different physical conditions. The electron density derived from the [S II] doublet ratio (∼0.7) yields 2 × 103 cm−3, a fairly typical value for the inner NLR of AGNs (Proxauf et al. 2014). It suggests moderate gas compression, likely from AGN winds or shocks. While this provides a reasonable estimate, it should be interpreted with caution, as gas compression inferred from this measurement may partly reflect averaging over regions with different densities and ionization conditions, possibly influenced by AGN winds or shocks.
3.2. Polarization
Focusing now on the polarized spectra of NGC 1275, we see several interesting features never reported before. First, looking at the polarized flux spectrum (that is, the total flux spectrum multiplied by P; see Fig. 1, top right), we see that the continuum appears wavelength-dependent, with dips of polarized fluxes at the location of the strongest narrow emission lines in comparison to the adjacent bins. This means that these lines are likely less polarized than the adjacent continuum, a common behavior in AGN spectropolarimetry (Antonucci 1993). Due to the low S/N of our spectrum, we have no evidence for the presence or the absence of broad lines in the polarized flux.
The de-biased, linear polarization degree (Fig. 1, bottom left) also varies across the spectrum. It is 3.23% ± 0.20% in the blue and 2.02% ± 0.11% in the red bands (see Table 2). The contribution of the host starlight – which is essentially unpolarized – decreases with wavelength, which could potentially explain why the polarization degree rises shortward of Hβ. Another potential explanation is that scattering efficiency drops at longer wavelengths, potentially revealing the emergence of a dominant dust-scattering component. In any case, both bands show significant polarization (well above errors), indicating that this is a real effect rather than noise.
Polarization in several bands (rest wavelengths).
The polarization angle (θ; Fig. 1, bottom right) shows a similar trend, averaging 164.0° ± 1.8° in the blue and 154.8° ± 1.6° in the red band (see Table 2). It thus rotates by 9.2° ± 2.4° between 4400−4780 Å and 5086−5675 Å, a wavelength dependence significant at the 3.8σ level that may reflect the relative contributions or intrinsic properties of different emitters and/or scatterers.
Antonucci (1984) reported a spectropolarimetric measurement of the same target, which would make it the first spectropolarimetric observation of NGC 1275, but no spectra were presented. Only an integrated polarization (P) of 0.85% ± 0.10% at θ = 120° ± 3° is quoted, but the author judged it to be spurious as it was strongly affected by ISP. We now know that the ISP is less than 0.2% and the low P recorded at the time was likely due to a combination of intrinsic variability and methodological differences (e.g., a larger aperture increasing the host galaxy contribution).
The [O III] doublet polarization we measure (see Table 2) agrees within the uncertainties with the value reported by Goodrich (1992): 1.87% ± 0.39% at 149° ± 6° in the forbidden lines. This suggests the [O III] polarization has remained stable over 35 years. According to Goodrich (1992), the lines are essentially polarized by transmission through aligned dust grains (Antonucci & Miller 1985), which would explain their temporal stability.
4. Discussion and conclusions
We have found that the optical polarized spectrum of NGC 1275 displays typical type-2 AGN features: narrow emission lines only, strong [O III], [N II], and [S II] features indicative of AGN photoionization and/or shock excitation (which are common in cooling flow filaments), a moderate polarization degree in the continuum, and lower polarization in the lines. These are all common signatures of Seyfert-2 and radio-loud narrow-line galaxies, in which the core thermal emission is scattered onto the polar outflows toward the observer. However, two elements are not consistent with type-2 AGNs: first, the optical polarization degree of NGC 1275 is known to be variable on weekly timescales (Babadzhanyants et al. 1972; Shkodkina et al. 2025); second, there is the issue of the alignment between the continuum polarization angle and the radio jet axis.
Focusing on the first point, archival data show that the R-band polarization from NGC 1275 varies from 1 to 6% (Liodakis et al. 2025), with extreme θ rotations, yet with a time-averaged value of 151° (34° standard deviation). Such variations are typical of BL Lacertae-like objects (Martin et al. 1976; Hovatta et al. 2016), i.e., blazing radio-loud AGNs where the observed optical polarization comes from synchrotron emission. Polarization variability is the telltale signature of relativistic electrons gyrating in a magnetic field. However, NGC 1275’s modest polarization levels and the presence of line polarization across forbidden and Balmer lines suggest synchrotron emission is not the sole contributor. While the depolarization of a polarized continuum by strong unpolarized lines can indeed mimic line polarization – as is often seen in blazars (Schutte et al. 2022) – the fairly consistent polarization angle (∼150°) across both the continuum and lines points toward an additional scattering component with a stable geometry.
Focusing on the second issue brings a possible solution to light 73 cm (0.4 GHz) radio continuum observations of NGC 1275 revealed a radio jet extending at a position angle of ∼160° on arcsecond scales (Pedlar et al. 1983). However, subsequent high-resolution radio observations have shown that the jet orientation is strongly scale-dependent: ∼171° at 10 mas (∼4 pc; Venturi et al. 1993) and about −147° at a few milliarcseconds (Savolainen et al. 2023). This variability complicates a direct comparison between the optical polarization angle reported here (∼158°) and a fixed radio jet position angle. Nonetheless, the apparent alignment between the two on similar, arcsecond scales suggests that synchrotron emission from the jet strongly contributes to the observed optical polarization, probably superimposed on a background of nuclear photons scattered by electrons or dust in the NLR (as revealed by the change in P and θ in the blue band). In this tentative scenario, the combination of synchrotron and scattering origins could naturally account for both the temporal variability observed in broadband polarimetry and the spectral features identified in our data.
However, a critical question that remains unanswered is whether NGC 1275 possesses a BLR (Punsly et al. 2018). Answering this question would help determine whether the observed radio to X-ray continuum emission is entirely due to jet-related synchrotron processes, or if there are additional contributions (e.g., from the accretion disk, corona, or thermal gas; see Marin et al. 2025 for an example). This requires longer, deeper polarimetric observations in the same band in order to reach sufficient S/N to detect the presence or absence of broad lines in polarized flux and properly measure the polarization in the narrow components. In addition, time-resolved spectropolarimetry could help separate variability from structural effects and quantify the scattered-to-synchrotron ratio.
Acknowledgments
We would like to deeply thank the anonymous referee for his/her constructive comments. Based on observations made with the Nordic Optical Telescope, owned in collaboration by the University of Turku and Aarhus University, and operated jointly by Aarhus University, the University of Turku and the University of Oslo, representing Denmark, Finland and Norway, the University of Iceland and Stockholm University at the Observatorio del Roque de los Muchachos, La Palma, Spain, of the Instituto de Astrofisica de Canarias. The NOT data were obtained under program ID 70-414. The data presented here were obtained with ALFOSC, which is provided by the Instituto de Astrofisica de Andalucia (IAA) under a joint agreement with the University of Copenhagen and NOT. I.L. was funded by the European Union ERC-2022-STG – BOOTES – 101076343. Views and opinions expressed are however those of the authors only and do not necessarily reflect those of the European Union or the European Research Council Executive Agency. Neither the European Union nor the granting authority can be held responsible for them. DH is research director at the F.R.S.-FNRS, Belgium. M. Turkki was supported by Research Council of Finland project 362571.
References
- Abdo, A. A., Ackermann, M., Ajello, M., et al. 2009, ApJ, 699, 31 [Google Scholar]
- Aguerri, J. A. L., Girardi, M., Agulli, I., et al. 2020, MNRAS, 494, 1681 [NASA ADS] [CrossRef] [Google Scholar]
- Antonucci, R. R. J. 1984, ApJ, 278, 499 [NASA ADS] [CrossRef] [Google Scholar]
- Antonucci, R. 1993, ARA&A, 31, 473 [Google Scholar]
- Antonucci, R. R. J., & Miller, J. S. 1985, ApJ, 297, 621 [NASA ADS] [CrossRef] [Google Scholar]
- Babadzhanyants, M. K., Gagen-Torn, V. A., & Lyutyi, V. M. 1972, Astrophysics, 8, 300 [Google Scholar]
- Baldwin, J. A., Phillips, M. M., & Terlevich, R. 1981, PASP, 93, 5 [Google Scholar]
- Best, P. N., von der Linden, A., Kauffmann, G., Heckman, T. M., & Kaiser, C. R. 2007, MNRAS, 379, 894 [Google Scholar]
- Chincarini, G. L., Giovanelli, R., & Haynes, M. P. 1983, A&A, 121, 5 [Google Scholar]
- Churazov, E., Forman, W., Jones, C., & Böhringer, H. 2003, ApJ, 590, 225 [NASA ADS] [CrossRef] [Google Scholar]
- Conselice, C. J., Gallagher, J. S., III, & Wyse, R. F. G. 2001, AJ, 122, 2281 [NASA ADS] [CrossRef] [Google Scholar]
- Fabian, A. C., Sanders, J. S., Allen, S. W., et al. 2003, MNRAS, 344, L43 [NASA ADS] [CrossRef] [Google Scholar]
- Fitzpatrick, E. L. 1999, PASP, 111, 63 [Google Scholar]
- Goodrich, R. W. 1992, ApJ, 399, 50 [Google Scholar]
- Hovatta, T., Lindfors, E., Blinov, D., et al. 2016, A&A, 596, A78 [NASA ADS] [CrossRef] [EDP Sciences] [Google Scholar]
- Kennicutt, R. C., Jr. 1992, ApJS, 79, 255 [NASA ADS] [CrossRef] [Google Scholar]
- Liodakis, I., Chakraborty, S., Marin, F., & Ehlert, S. E. 2025, ApJ, submitted [Google Scholar]
- Marin, F., Hutsemékers, D., Jiang, C. Z., et al. 2025, A&A, 695, A55 [NASA ADS] [CrossRef] [EDP Sciences] [Google Scholar]
- Martin, P. G., Angel, J. R. P., & Maza, J. 1976, ApJ, 209, L21 [Google Scholar]
- Netzer, H. 1990, in Active Galactic Nuclei, eds. R. D. Blandford, H. Netzer, L. Woltjer, T. J. L. Courvoisier, & M. Mayor, 57 [Google Scholar]
- Panopoulou, G. V., Markopoulioti, L., Bouzelou, F., et al. 2025, ApJS, 276, 15 [NASA ADS] [CrossRef] [Google Scholar]
- Paraschos, G. F., Mpisketzis, V., Kim, J. Y., et al. 2023, A&A, 669, A32 [NASA ADS] [CrossRef] [EDP Sciences] [Google Scholar]
- Pedlar, A., Booler, R. V., & Davies, R. D. 1983, MNRAS, 203, 667 [Google Scholar]
- Piirola, V., Berdyugin, A., Frisch, P. C., et al. 2020, A&A, 635, A46 [NASA ADS] [CrossRef] [EDP Sciences] [Google Scholar]
- Piirola, V., Kosenkov, I. A., Berdyugin, A. V., Berdyugina, S. V., & Poutanen, J. 2021, AJ, 161, 20 [Google Scholar]
- Prochaska, J., Hennawi, J., Westfall, K., et al. 2020, J. Open Source Softw., 5, 2308 [NASA ADS] [CrossRef] [Google Scholar]
- Proxauf, B., Öttl, S., & Kimeswenger, S. 2014, A&A, 561, A10 [NASA ADS] [CrossRef] [EDP Sciences] [Google Scholar]
- Punsly, B., Marziani, P., Bennert, V. N., Nagai, H., & Gurwell, M. A. 2018, ApJ, 869, 143 [Google Scholar]
- Rhea, C. L., Hlavacek-Larrondo, J., Gendron-Marsolais, M.-L., et al. 2025, AJ, 169, 203 [Google Scholar]
- Savolainen, T., Giovannini, G., Kovalev, Y. Y., et al. 2023, A&A, 676, A114 [NASA ADS] [CrossRef] [EDP Sciences] [Google Scholar]
- Schutte, H. M., Britto, R. J., Böttcher, M., et al. 2022, ApJ, 925, 139 [Google Scholar]
- Shkodkina, E. A., Savchenko, S. S., Morozova, D. A., et al. 2025, RAA, 25, 065010 [Google Scholar]
- Simmons, J. F. L., & Stewart, B. G. 1985, A&A, 142, 100 [NASA ADS] [Google Scholar]
- Turnshek, D. A., Bohlin, R. C., Williamson, R. L., II, et al. 1990, AJ, 99, 1243 [NASA ADS] [CrossRef] [Google Scholar]
- Venturi, T., Readhead, A. C. S., Marr, J. M., & Backer, D. C. 1993, ApJ, 411, 552 [NASA ADS] [CrossRef] [Google Scholar]
- Veron, P. 1978, Nature, 272, 430 [Google Scholar]
- Weisskopf, M. C., Soffitta, P., Baldini, L., et al. 2022, J. Astron. Telesc. Instrum. Syst., 8, 026002 [NASA ADS] [CrossRef] [Google Scholar]
- Wilman, R. J., Edge, A. C., & Johnstone, R. M. 2005, MNRAS, 359, 755 [NASA ADS] [CrossRef] [Google Scholar]
All Tables
All Figures
|
Fig. 1. NGC 1275 as observed with NOT/ALFOSC on March 21, 2025. Top left: Total flux spectrum (corrected for instrumental response, in arbitrary units). Top right: Polarized flux (total flux multiplied by the polarization degree). Bottom left: Linear polarization degree (Pd). Bottom right: Polarization position angle (θ). All but the total flux spectrum were re-binned to 137 consecutive pixels (∼237 Å), with observational errors indicated per spectral bin. |
| In the text | |
Current usage metrics show cumulative count of Article Views (full-text article views including HTML views, PDF and ePub downloads, according to the available data) and Abstracts Views on Vision4Press platform.
Data correspond to usage on the plateform after 2015. The current usage metrics is available 48-96 hours after online publication and is updated daily on week days.
Initial download of the metrics may take a while.