Fig. 5
Download original image
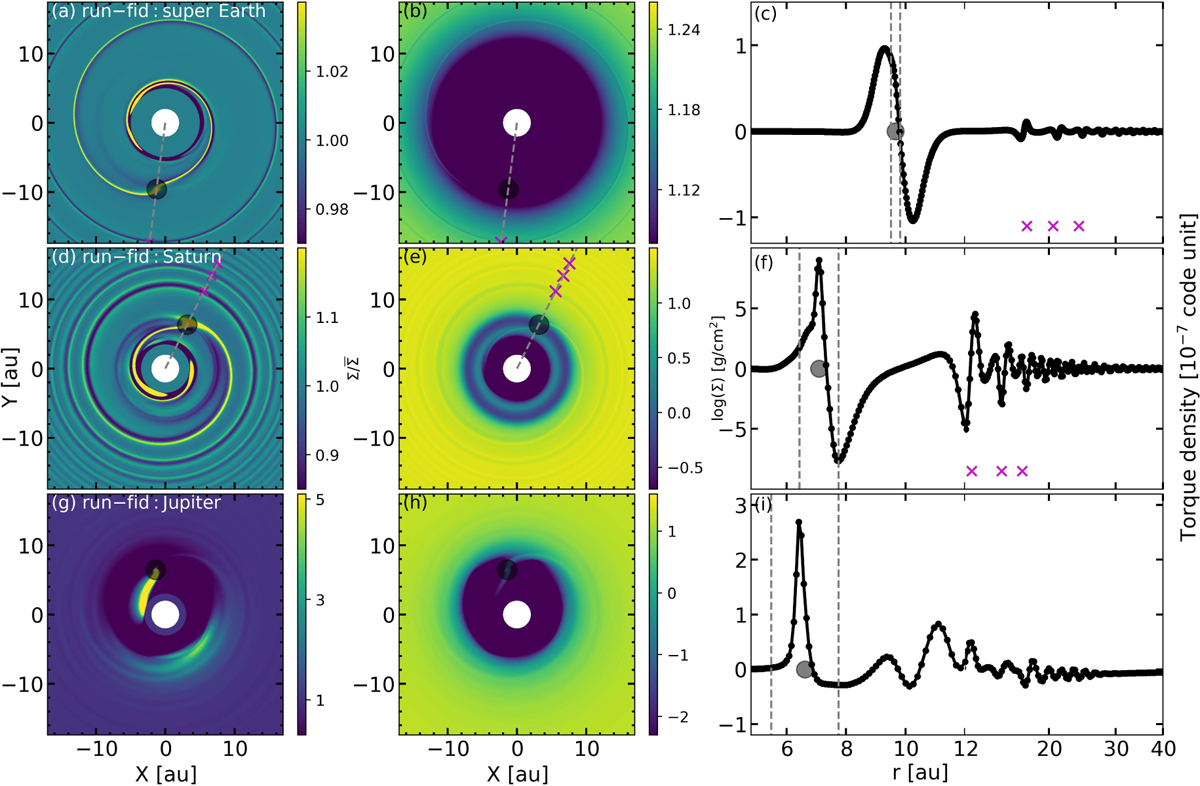
Surface density perturbation of ![]() (left) and log(Σ) (middle), and specific torque density as a function of orbital distance (right) in run-fid for a super-Earth planet of 3 M⊕ (upper panels, t = 4× 10⁴ P0), a Saturn-mass planet (middle panels, t=l.4×104 P0), and a Jupiter-mass planet (lower panels, t = 3.5 × 10⁴ P0). The location of the planet is marked by a gray circle. The data used to compute the torque density are averaged over 20 snapshots in 1 P0, the purple crosses in the top and middle rows of panels indicate the wiggle torque positions, and the radial width between the vertical dashed lines is Δrwith = 2 max(rH, rhs). For visibility, the x-axes in the right panels use a linear scale up to 12 au and a logarithmic scale beyond that.
(left) and log(Σ) (middle), and specific torque density as a function of orbital distance (right) in run-fid for a super-Earth planet of 3 M⊕ (upper panels, t = 4× 10⁴ P0), a Saturn-mass planet (middle panels, t=l.4×104 P0), and a Jupiter-mass planet (lower panels, t = 3.5 × 10⁴ P0). The location of the planet is marked by a gray circle. The data used to compute the torque density are averaged over 20 snapshots in 1 P0, the purple crosses in the top and middle rows of panels indicate the wiggle torque positions, and the radial width between the vertical dashed lines is Δrwith = 2 max(rH, rhs). For visibility, the x-axes in the right panels use a linear scale up to 12 au and a logarithmic scale beyond that.
Current usage metrics show cumulative count of Article Views (full-text article views including HTML views, PDF and ePub downloads, according to the available data) and Abstracts Views on Vision4Press platform.
Data correspond to usage on the plateform after 2015. The current usage metrics is available 48-96 hours after online publication and is updated daily on week days.
Initial download of the metrics may take a while.