| Issue |
A&A
Volume 702, October 2025
|
|
|---|---|---|
| Article Number | A142 | |
| Number of page(s) | 10 | |
| Section | Planets, planetary systems, and small bodies | |
| DOI | https://doi.org/10.1051/0004-6361/202556167 | |
| Published online | 15 October 2025 | |
Hydrodynamical simulations of planet rebound migration in photo-evaporating disks
1
Institute for Astronomy, School of Physics, Zhejiang University,
Hangzhou
310027,
China
2
Center for Cosmology and Computational Astrophysics, Institute for Advanced Study in Physics, Zhejiang University,
Hangzhou
310027,
China
3
IRAP, Université de Toulouse, CNRS, CNES,
Toulouse,
France
4
Department of Physics and Astronomy, University of Nevada,
Las Vegas,
NV
89154-4002,
USA
5
Shanghai Astronomical Observatory, Chinese Academy of Sciences,
Shanghai
200030,
China
6
TU Delft, Faculty of Aerospace Engineering,
Kluyverweg 1,
2629 HS
Delft,
The Netherlands
★ Corresponding author: This email address is being protected from spambots. You need JavaScript enabled to view it.
Received:
30
June
2025
Accepted:
5
September
2025
Abstract
This study investigates the orbital migration of a planet located near the truncated edge of protoplanetary disks, induced by X-ray photo-evaporation originating from the central star. The combined effects of turbulent viscous accretion and stellar X-ray photo-evaporation give rise to the formation of a cavity in the central few astronomical units in disks. Once the cavity is formed, the outer disk experiences rapid mass loss and the cavity expands from the inside out. We conducted 2D hydrodynamical simulations of planet-disk interaction for various planet masses and disk properties. Our simulations demonstrate that planets up to about Neptune masses experience a strong positive corotation torque along the cavity edge that leads to sustained outward migration – a phenomenon previously termed rebound migration. Rebound migration is more favorable in disks with moderate stellar photo-evaporation rates of ~10−8 M⊙ yr−1. Saturn-mass planets only experience inward migration, due to significant gas depletion in their co-orbital regions. In contrast, Jupiter-mass planets are found to undergo modest outward migration as they cause the residual disk to become eccentric. This work presents the first 2D hydrodynamical simulations that confirm the existence and viability of rebound outward migration during the inside-out clearing in protoplanetary disks.
Key words: planets and satellites: formation / planet-disk interactions
© The Authors 2025
 Open Access article, published by EDP Sciences, under the terms of the Creative Commons Attribution License (https://creativecommons.org/licenses/by/4.0), which permits unrestricted use, distribution, and reproduction in any medium, provided the original work is properly cited.
This article is published in open access under the Subscribe to Open model. This email address is being protected from spambots. You need JavaScript enabled to view it. to support open access publication.
1 Introduction
Embedded planets tidally interact with their natal gaseous pro-toplanetary disks, inducing orbital migration (Lin & Papaloizou 1993; Kley & Nelson 2012; Baruteau & Masset 2013; Baruteau et al. 2014; Paardekooper et al. 2023). Low-mass planets, like super-Earths and Neptune-mass planets, have a modest influence on their disk’s structure, with net angular momentum transfer originating from Lindblad and corotation resonances. The resulting wave torque and corotation torque (also known as horseshoe drag) have been extensively studied (Goldreich & Tremaine 1980; Ward 1997; Tanaka et al. 2002; Baruteau & Masset 2008; Paardekooper et al. 2010, 2011; Benítez-Llambay et al. 2015; McNally et al. 2019; Wu et al. 2024). On the other hand, more massive gas giant planets strongly perturb their disk and create annular gaps in the proximity of their orbits, leading to a complex coupling between their orbital motion and disk evolution (Lin & Papaloizou 1986; Lin et al. 1996; Nelson et al. 2000; Lubow & D’Angelo 2006; Ida et al. 2013; Dürmann & Kley 2015; Dong et al. 2015; Kanagawa et al. 2018; Robert et al. 2018; Chen et al. 2020; Li et al. 2024). Nonetheless, most of the literature studies have focused on planet-disk interaction in disks with originally smooth density profiles, leaving the understanding of how planets migrate in structured disks near the cavity–disk boundary relatively unexplored.
Masset et al. (2006) first investigated how the torque balance is affected at disk locations where the gas density gradient is reversed, for instance near a cavity. For low-mass planets, the strength and direction of the corotation torque are sensitive to the local density gradient, and when this gradient is sufficiently large and positive, planets can experience a large, positive corotation torque that effectively halts inward migration (Masset et al. 2006; Hu et al. 2016). Liu et al. (2017) propose that the inner disk is truncated at the magnetospheric cavity radius, typically located at orbital distances of r≲0.1 au from the central star, with the exact distance depending on the topology and strength of the star’s magnetic field (Koenigl 1991; Romanova et al. 2003; Zhu et al. 2024; Zhu 2025). It serves as a natural location for reversing the direction of planet migration. Liu et al. (2017) show via analytical calculations that, depending on the disk properties and planet mass, the corotation torque can become strong enough to overcome the negative, outer Lindblad torque. Such ideas have been further supported by dedicated hydrodynamical simulations (Miranda & Lai 2018; Romanova et al. 2019, 2025). In addition, as the gas disk depletes, the magnetospheric cavity expands, resulting in a cessation of inward planet migration and a subsequent outward movement. This mechanism, known as rebound, can cause planet pairs to move out of mean-motion resonances (Liu et al. 2017; Huang & Ormel 2022; Hansen et al. 2024), which could explain the numerous non-resonant planet pairs detected by the Kepler mission (Fabrycky et al. 2014; Liu & Ormel 2017; Pan et al. 2025).
Stellar photo-evaporation (PE) plays a crucial role in the evolution of protoplanetary disks (Alexander et al. 2014; Ercolano & Pascucci 2017). During the early stages, the dominant mechanism of disk evolution is turbulent accretion (Ercolano & Pascucci 2017) and the influence of stellar PE is minimal1. However, once the disk accretion rate falls below the stellar PE mass-loss rate, the dissipation of the disk is governed by the photo-evaporative wind originating from the central star’s high-energy radiation (Alexander et al. 2006; Owen et al. 2011; Wang & Goodman 2017; Picogna et al. 2019, 2021). As a result, an inner disk cavity is formed, typically located at a few astronomical units. The gas inside this radius is rapidly accreted onto the central star, while the gas beyond it evaporates as a wind. Consequently, the inner disk cavity expands from the inside out. Building upon the concept of the rebound mechanism operating at the magnetospheric cavity radius, Liu et al. (2022) propose that the large-scale retreat of the PE-induced disk edge can naturally explain the orbital structure of the four giant planets in the Solar System. Additionally, rebound-triggered dynamical instabilities may have broad implications, and could play a role in the eccentricity distribution of warm/cold Jupiters (see also Debras et al. 2021 for a different mechanism).
In light of the pioneering study of Liu et al. (2022), in this study we conducted dedicated hydrodynamical simulations, for the first time, to verify the robustness of the rebound mechanism under various realistic conditions. We investigated the migration of a single planet of various masses embedded near the boundary of the cavity in an inner truncated disk induced by stellar PE.
The paper is organized as follows. The model setup and numerical procedure are introduced in Sect. 2. The migration of a single planet with four characteristic masses for the fiducial run is described in Sect. 3. Section 4 explores the influence of the initial disk surface density profile, PE mass-loss rate, and disk aspect ratio on migration pattern. Finally, we summarize our key findings in Sect. 5.
2 Method
We considered a razor-thin gaseous disk orbiting a solar-mass star and hosting one planet. A 2D cylindrical coordinate system (r, ϕ) was adopted, with the frame centered at the stellar location. The disk was assumed to evolve through radial turbulent transport modeled as a viscous accretion process, PE due to the central star, and disk-planet interactions. The governing equations are
 (1)
(1)
where Σ, P, υ, and fv represent the gas surface density, pressure, velocity, and viscous force per unit mass, all of which are integrated over the vertical extent of the disk. The total gravitational potential is the sum of the direct contributions from the star and planet, and the indirect contribution of the planet related to the acceleration of the coordinate frame:
![Mathematical equation: $\matrix{ {\Phi = - {{G{M_ \star }} \over r} - {{G{M_{\rm{p}}}} \over {{{\left[ {{r^2} - 2r{r_{\rm{p}}}\,\cos \left( {\phi - {\phi _{\rm{p}}}} \right) + r_{\rm{p}}^2 + {^2}} \right]}^{1/2}}}}} \cr {\,\,\, + {{G{M_{\rm{p}}}} \over {r_{\rm{p}}^2}}r\,\cos \left( {\phi - {\phi _{\rm{p}}}} \right),} \cr } $](/articles/aa/full_html/2025/10/aa56167-25/aa56167-25-eq2.png) (2)
(2)
where G is the gravitational constant, M★ is the stellar mass, and Mp, rp, and ϕp are the mass, radial distance, and azimuthal angle of the planet. The softening parameter (ϵ) was set to 0.6 times the disk’s pressure scale height at the planet’s orbital radius. We assumed that the disk gas is described by a locally isothermal equation of state, where the gas temperature varies with radius but stays constant in time (the disk’s aspect ratio is specified below). Additionally, we neglected the disk’s self-gravity and gas accretion onto the planet. Since the disk’s self-gravity was ignored, so was the indirect term arising from the disk (Crida et al. 2025).
We took the effect of high-energy radiation from the central star on the disk gas into account. Intense stellar radiation heats the upper layers of the disk, causing the hot gas ≳103 K to escape as a photo-evaporative wind (Alexander et al. 2014; Ercolano & Pascucci 2017). This process, known as stellar PE, is incorporated in our model by the source term  in the mass conservation equation (see Eq. (1)). In this work, we focused specifically on stellar X-ray radiation. Since the X-ray luminosity of a solar-mass star remains relatively constant during the short time span of the disk evolution that we considered (see Kunitomo et al. 2021),
  was treated as time-independent and only varies with r.
Owen et al. (2011, 2012) calculated a  profile based on their radiation-hydrodynamical model. For a solar-mass star with an X-ray luminosity of LX = 1030 erg s−1, the total PE rate is ṀPE ≈ 1.6×10⁻⁸ M⊙ yr−1 (Owen et al. 2012). Following the same approach as Bae et al. (2013), we adopted the primordial disk prescription from Owen et al. (2012) and normalized
  to conserve the total integrated mass loss rate
  (see their Appendix B1). By default, we adopted the Owen et al. (2012) standard mass-loss rate, but different ṀPE values are explored in Sect. 4.22.
To investigate planet migration in a photo-evaporating disk during the gas dispersal phase, we employed Dusty FARGO-ADSG, an upgraded version of the original 2D Eulerian grid-based hydrodynamical FARGO code (Masset 2000). We implemented the calculation of  as specified above. The inclusion of PE implies that simulations are not scale-free and require specifying code units. In our setup, the code’s units of length, mass, and time are r0 = 10 au, M0 = M★ = 1 M⊙,
  (see Table 1). In addition, we defined P0 = 2π/Ω0 and adopt it as the canonical time unit for the figures.
We assumed that the gas turbulent viscosity is given by v = αcsH, with α = 10−3, where cs is the sound speed, H = h × r = cs/ΩK is the disk’s pressure scale height, h is the disk aspect ratio, and  is the Keplerian angular frequency. The initial profiles of the surface density and aspect ratio are given by Σ0(r) = Σ0(r/r0)s and h(r) = h0(r/r0)k, with default parameters Σ0 = 44 g cm−2, s = −0.5, h0 = 0.052, and k = 0.25. Our default disk temperature (Td) was computed by assuming that the disk is heated by stellar irradiation and cooled by the black-body emission from two surface layers. This yields
  , where the grazing angle of starlight on the disk surface θ is set to 0.2 rad, = L★=L⊙ is the luminosity of a solar-mass star, and σSB is the Stefan-Boltzmann constant. Different values of s and h0 will be explored in Sects. 4.1 and 4.3, respectively. A summary of the main parameters used in the simulations is provided in Table 2.
The computational domain extends from rmin = 0.2r0 to rmax = 10r0 in the radial direction, and covers the full 2π in the azimuthal direction. Cells are sampled logarithmically in the radial direction and linearly in the azimuthal direction. Three grid resolutions are used: low (Nr = 300, Nϕ = 480), medium (Nr = 480, Nϕ = 770) and high (Nr = 1200, Nϕ = 1900). The low resolution is used for Jupiter-mass planets (318 Earth masses), the medium resolution for the Neptune- and Saturn-mass planets (17 and 95 Earth masses, respectively), and the high resolution for super-Earth planets (3 Earth masses). The values of Nr ensure that the full width of the planet’s horseshoe region ( is the planet-to-star mass ratio) is covered by about ten radial cells, thereby guaranteeing sufficient resolution of the corotation torque. The values of Nϕ yield approximately square grid cells such that
 (3)
(3)
Simulating disk evolution and planet migration over the disk lifetime remains numerically impractical in 2D. The disk slowly evolves viscously for most of its lifetime, and PE becomes dominant only when its mass loss rate exceeds the viscous accretion rate, subsequently driving rapid disk dispersal (Alexander et al. 2014). We aimed to investigate how planets migrate during this advanced phase of the disk evolution when it has opened an inner cavity. Thus, to optimize computational efficiency, we first evolved the disk in 1D (Nϕ= 1) without a planet, until the inner hole had just about formed. We then restarted the simulations in 2D by including the planet. This second stage is hereafter referred to as the PE-dominated disk phase. In our 2D simulations the planet is introduced at its current mass without considering any mass tapering treatment. Since the time for a giant planet to establish a gap is much shorter than both the simulation duration and the period required for rebound migration to occur (see Sect. 3), we did not expect that different planet mass release manners (slow vs. rapid increase) would affect our results.
In the 1D simulations, a standard open boundary condition is applied at both the inner and outer radial edges of the grid. For the 2D simulations, we employed wave-damping zones extending over [0.2–0.35]r0 and [8.2–10]r0 at the grid’s inner and outer edge to avoid reflections of the planet wake. In this so-called wave-killing zone, the radial and azimuthal velocities are damped toward their initial profile, while the density is damped toward a threshold value of Σ = 10−5 g/cm2 − the same as that used in the PE module to reset the gas surface density wherever it falls below that value.
The specific disk torque onto the planet Γ is given by
 (4)
(4)
where Φp is the planet’s gravitational potential (second term on the right-hand side of Eq. (2)), T(r) is the specific torque density that represents the ϕ-averaged torque over the radial grid cells.
Code units and corresponding physical values.
Main parameters of the simulations.
3 Single planet migration
In this section, we present the results of simulations with our fiducial model (run-fid in Table 2). We examine four planet masses: 3, 17, 95, and 318 M⊕, representative of super-Earth, Neptune, Saturn, and Jupiter-mass planets, respectively. All planets are placed at r0 = 10 au at the beginning of the 2D simulations, so that their orbit remains well outside the formation region of the photo-evaporative cavity. The results for each planet mass are described in the following subsections.
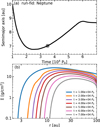 |
Fig. 1 Migration of a Neptune-mass planet (panel a) and disk surface density evolution (panel b) in simulation run-fid. In panel a. the solid curve shows the time evolution of the planet’s semimajor axis. The gray circle marks the planet position at the time shown in Figs. 2 and 3. The planet undergoes a reversal in migration direction (termed “rebound migration”) as the inner photo-evaporative cavity expands from the inside out. The video can be downloaded from: https://github.com/bbliu-astro/movies/blob/main/hydrodynamic_rebound/Neptune.gif and online. |
3.1 Neptune-mass planet
Figure 1 illustrates the evolution of the semimajor axis and disk surface density for a Neptune-mass planet in the fiducial run (run-fid). The planet is inserted at t= 104P0, after the inner hole has just formed. The planet first migrates inward, reaching ~6.7 au at t = 2.5 × 10⁴ P0 (Fig. 1a). As the planet approaches the edge of the cavity, migration reverses and the planet moves outward over the next 3.5 × 10⁴ P0. This rebound migration coincides with the expansion of the inner photo-evaporative cavity (Fig. 1b). The planet eventually stalls at ~8.7 au after 6 × 10⁴ P0 as the disk has moved beyond the orbit of the planet.
Figure 2 display the snapshot of the perturbed surface density in Cartesian coordinates at t = 3.5 × 10⁴ P0. More specifically, the quantity  is displayed with
  , the instantaneous axisymmetric surface density in Fig. 2a, while the absolute surface density log(Σ) is shown Fig. 2b. The inner hole is in the central 5.5 au and the planet is at x = 5.7 au, y = 4.1 au (gray circle). The planet’s spiral wakes are clearly visible, but the inner wake does not show up in the cavity since the disk’s surface density there is reset to the minimum threshold value allowed in the simulation. The snapshot also highlights an asymmetric density perturbation in the planet’s co-orbital region, with a positive (negative) density perturbation in front of (behind) the planet in the azimuthal direction. This suggests that a significant corotation torque is exerted on the planet.
To gain further insight into the mechanism behind outward migration, Fig. 2c shows the radial profile of the specific torque density T given by Eq. (4). To minimize the effects of temporal fluctuations, T has been averaged over 20 snapshots within 1 P0. Not surprisingly, the gas interior to the planet exerts positive torques, while the gas exterior to the planet exerts negative torques. The total torque is a sum of these negative and positive components. The vertical dashed lines mark the region of the width around the planet ∆rwith = 2 max(rH, rhs), where  is the planet Hill radius, qp = Mp/M★, and
  is the half-width of its horseshoe region (Paardekooper et al. 2010). This region is where the torque density is strongest. We point out that the two peaks in the torque density are not symmetric with respect to the planet, in terms of both the radial position and amplitude. In particular, the inner peak in the torque density is larger than the outer peak, further indicating that the planet experiences a strong, positive corotation torque. We also note that beyond the location of the outer 1:2 Lindblad resonance, the torque density exhibits radial oscillations with negative and positive values and with a steadily decreasing amplitude as r increases. This phenomenon, referred to as “wiggle torques” in Cimerman et al. (2024), has been found in numerous hydrodynamical simulations (Rafikov & Petrovich 2012; Arzamasskiy et al. 2018; Dempsey et al. 2020). It occurs where the wake crosses the ϕ = ϕp line as the spiral propagates (indicated by crosses in Figs. 2a and 2b). The net contribution of these oscillating torque components is very small compared to the torque components near the planet (within about 10% of the planet’s orbital radius).
Figure 3a shows the inverse vortensity of the disk close to the planet’s position. It is defined as
 (5)
(5)
where B = (∇× υ)z/2 is the second Oort constant related to the z-component of flow vorticity. In locally isothermal disks, the corotation torque (Γc) features two components: one related to the local density gradient, and one to the local temperature gradient (see >Eq. (49) in Paardekooper et al. 2010). Along the edge of the disk cavity, the former far exceeds the latter, so in practice Γc ∝ Σ × d log ζ/d log r at the planet’s orbital radius rp: the local radial gradient of ζ(r) determines the sign and strength of the corotation torque. Figure 3a highlights an azimuthal asymmetry in ζ within the planet’s horseshoe region: the part in front of the planet in the azimuthal direction exhibits significantly higher ζ values than the part behind the planet, which is consistent with the density distribution in Fig. 2a. This is further confirmed by the colored curves in Fig. 3b, which show that the ζ gradient across the planet is essentially set by the density gradient rather than by the vorticity gradient. The positive torque exerted by the horseshoe fluid elements flowing inward relative to the planet is thus much greater than the negative torque due to the horseshoe fluid elements flowing outward relative to the planet. This yields a net positive corotation torque on the planet, consistent with the observed outward migration.
The asymmetric corotation torque observed in our simulations is theoretically supported by Liu et al. (2017). Their analysis assumed rapid gas removal at a sharp disk edge, such that only the upper horseshoe stream contributes to angular momentum exchange, producing a maximal, positive corotation torque (termed “one-sided torque”). Our realistic hydrodynamical simulations reveal a more moderate but consistent asymmetry, yielding a net positive torque that drives outward planet migration. Notably, such a cavity driving planet rebound migration was first conceptually tested in Masset et al. (2006) via a manually imposed moving cavity (their Fig. 5), and recently explored in Romanova et al. (2025) with a disc-magnetosphere boundary based on dedicated MHD simulations (their Fig. 9).
In summary, in the PE-dominated disk phase, a Neptune-mass planet can experience significant outward migration during the inside-out expansion of the photo-evaporative cavity. The net positive torque felt by the planet mainly arises from the asymmetric distribution of inverse vortensity in the planet’s horseshoe region.
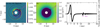 |
Fig. 2 Surface density perturbation of |

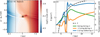 |
Fig. 3 Inverse vortensity (ζ) close to the planet in the r−ϕ frame (panel a) and surface density profile and corotation torque components (panel b) in run-fid for a Neptune-mass planet at t = 3.5 × 10⁴ P0. In both panels, the width between the vertical dashed lines is 2 max(rH, rhs). The asymmetric ζ distribution between the upper and lower parts of the horseshoe region results in a strong, positive corotation torque. |
3.2 Super-Earth-mass planet
We also performed a simulation with a super-Earth planet of 3 M⊕. Figure 4a shows that the planet’s inward migration stalls at r~9.5 au near t = 2.5 × 10⁴ P0, and then reverses as the cavity edge sweeps out. The planet goes back to ~10 au at t = 5 × 10⁴ P0 au3.
Compared to the Neptune-mass planet run shown in the previous subsection, the density perturbation arising from the spiral wakes is weaker, at the 1–2% level (Fig. 5a). The asymmetric density perturbation in the planet’s horseshoe region is also reduced, though still clearly visible. Interestingly, we see that the torque density distribution differs a bit from the Neptune-mass planet case; in particular, the negative and positive peaks now have more equal amplitudes (Fig. 5c). Still, the torque distribution in the immediate planet vicinity (marked by the vertical dashed lines) reveals a substantial, positive corotation torque. In summary, our simulations show that the low-mass planets (both Neptune-like and super-Earth-like planets) exhibit similar rebound migration behavior during the expansion of the photo-evaporative cavity.
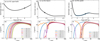 |
Fig. 4 Evolution of the semimajor axis (top) and disk surface density (bottom) in simulations run-fid for a super-Earth planet of 3 M⊕ (left), a Saturn-mass planet (middle), and a Jupiter-mass planet (right). In the upper panels the gray circles mark the planet’s position used in Fig. 5, and the cyan area in the top-right panel shows the radial extent between the planet’s pericenter and apocenter. The video can be downloaded from: https://github.com/bbliu-astro/movies/blob/main/hydrodynamic_rebound/superEarth.gif and online. |
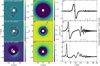 |
Fig. 5 Surface density perturbation of |

3.3 Saturn-mass planet
In the simulation with a Saturn-mass planet, we do not observe outward migration. The planet directly migrates into the disk cavity within t = 2 × 10⁴ P0 (Fig. 4c). At t = 1.4 × 10⁴ P0, there is a considerable depletion of gas both inside the cavity and at the location of the gap carved by the planet (Figs. 5d and 5e). In the gap, the disk exhibits a somewhat non-axisymmetric structure that we attribute to the onset of the Rossby wave instability. This and the (partial) gap formation around the planet could explain that the corotation torque is much less efficient at triggering outward migration than for the lower-mass planets investigated in the previous subsections.
3.4 Jupiter-mass planet
In contrast to the Saturn-mass planet, the Jupiter-mass planet did experience outward migration. Here the disk mass is too low for Jupiter-mass planet to undergo type III migration, as this rapid migration typically requires higher disk masses and specific dynamical conditions (e.g., co-orbital mass deficit; Masset & Papaloizou 2003; Peplinski et al. 2008). We note that the planet opens a gap at a relatively fast pace. The torque onto the planet from the impulse approximation reads  , where ∆≃Hp (Lin & Papaloizou 1993). This gives the gap opening time approximately a few hundred orbits for a Jupiter-mass or Saturn-mass planet (Figs. 4d and f). The cavity take much longer time to expand from 2 au to the approximate location of the planet. Thus, our setup describes a circumstance where the giant planet first opens a narrow gap. Later, stellar PE sets in and works in tandem to create a wide, common gap. In this case, the massive giant planet shortens the cavity opening time by reducing the flux across its orbit (also see Rosotti et al. 2013). We nevertheless do not expect qualitative differences in the outward migration pattern at different planet release times, although the detailed migration speed might differ.
Our result is shown in Fig. 4e: after a rapid phase of inward migration, the planet migrates outward at a much slower pace from about 6 to 6.6 au. At t = 3.5 × 10⁴ P0, Figs. 5g and 5h show a significant depletion of gas in the inner hole caused by both PE and the planet wakes. In comparison to the previous simulations with lower planet masses, it is clear that the Jupiter-mass planet strongly perturbs its surrounding disk. In particular, the disk exhibits an asymmetric, crescent-like structure just outside of the cavity (see the density enhancement near 5 o’clock in Fig. 5g), and the gas in the cavity is clearly eccentric.
Our results share some analogy with those of Dempsey et al. (2021) and Li et al. (2021). Dempsey et al. (2021) show that in 2D simulations when the dimensionless quantity  , migration is directed outward and the eccentricity of the disk beyond the planet goes from nearly circular to ≳0.2. Li et al. (2023) pointed out that a different criterion may be needed to excite the disk eccentricity in 3D simulations We find λ≃7 despite the fact that in our 2D simulation the planet is embedded in a cavity and therefore lacks an inner disk. In such a case, the disk can become eccentric and undergo apsidal precession at lower threshold values for λ than found in Dempsey et al. (2021). To further explore this, we computed the azimuthally averaged radial profile of the disk eccentricity following the method of Kley & Dirksen (2006) and Teyssandier & Ogilvie (2017). Assuming that the gas behaves as a pressure-less particle and moves in a Keplerian orbit around the central star, we computed the eccentricity for each gas cell using its local position and velocity vectors. The eccentricity of the gas ring at the radial distance (r) was then obtained by azimuthally averaging these cell values. The results are shown in Fig. 6 and compared with those of the simulations shown in Figs. 2 and 5. We see that in the Jupiter-mass planet simulation, the eccentricity of the disk outside the cavity reaches about 0.2, whereas for the lower-mass planets, it does not exceed 0.05. The non-axisymmetric overdensity that forms outside the cavity could result from the Rossby wave instability due to the strong density gradient across the cavity, or from a traffic jam due to the disk gas being eccentric (Ataiee et al. 2013). We note that in the simulation, the planet’s eccentricity does not exceed 0.02.
Furthermore, the torque density in this simulation is significantly altered and highly time-variable compared to the previous simulations with lower-mass planets. Instead of showing two lobes of similar shape and opposite signs, the torque density for the Jupiter-mass planet features a strong, positive contribution located close to the planet (Fig. 5i). Since the gas is substantially depleted in the vicinity of the planet, this torque component is attributed to inner Lindblad torques within the eccentric disk, where the wake becomes largely bent near the inner disk edge. The torque density in the outer disk still exhibits oscillations that now extend to more distant separations as a result of the disk eccentricity. Finally, the planet migrates outward mainly because of the unbalanced Lindblad torques, where the inner positive torque largely dominates over the outer negative torque.
It is worth noting that Monsch et al. (2021) also explored the migration of a Jupiter-mass planet near the photoevaporating cavity during the disk dispersal phase. While their study confirmed that the planet can be halted at the disk edge, they did not observe the outward migration. We suspect this difference may originate from the distinct PE models employed. Monsch et al. (2021) adopted the Picogna et al. (2019) PE profile. For a given stellar X-ray luminosity, this prescription produces a more significant mass loss in the outer disk regions and yields a higher total integrated mass-loss rate compared to the Owen et al. (2012) prescription used in our work. Consequently, the disk clears much faster in the Picogna et al. (2019) model, making the planet surfing on the expanding cavity more unlikely (see also Sect. 4.2).
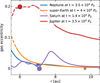 |
Fig. 6 Azimuthally averaged radial distribution of the disk eccentricity at the same times as in Figs. 2 and 5. The filled circles show the planet’s location in each simulation. The dashed curves indicate the gas-depleted cavity region, where the calculation of the gas eccentricity is strongly affected by the reset in the gas density. The Jupiter-mass planet excites a large eccentricity in its outer disk, in contrast to the three less massive planets. |
4 Exploration of the parameter space
To understand how rebound migration behaves in different disk conditions, we conducted a parameter study by varying the key parameters such as the disk’s surface density profile, its PE mass loss rate and aspect ratio. Here we specifically focused on the migration of a Neptune-mass planet. The results are illustrated in Fig. 7 and the model setups are provided in Table 2.
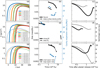 |
Fig. 7 Time evolution of the surface density profile of the disk (left panels), its mass (middle, black circles), the cavity’s expansion rate (middle, blue circles), and the semimajor axis of a Neptune-mass planet (right). All results are shown in the PE-dominated disk phase. The planet is released at different times throughout the simulations. The three rows of panels correspond to runs with different: slopes of the disk’s initial surface density profile (1), PE mass-loss rates (2), and disk aspect ratios (3; see Table 2). The thick solid and thin dashed curves across the panels show results for run-fid and run-Id in the top row, run-ph and run-pl in the middle row, and run-al and run-ah in the bottom row. |
4.1 Surface density profile
We carried out a simulation with an initial surface density slope of s= −1 instead of −0.5, keeping all other parameters the same as in the fiducial run. The results are shown in the top row of Fig. 7. For s = −1 (run-dl), the disk is initially lighter and therefore forms an inner cavity faster. At the onset of the PE-dominated disk phase, the disk mass is three times lower than in the fiducial run (see the black curves in Fig. 7b). Consequently, the inner cavity expands roughly proportionally faster: the edge of the inner cavity reaches 10 au within 2 × 10⁴ P0 for s = −1, and within 7 × 10⁴ P0 for s = −0.5 (Fig. 7a). This is also seen in Fig. 7b, where the blue lines show that the expansion rate of the cavity is about 20 au/Myr for s = −1, while it remains below 7 au/Myr for s = −0.5. However, the maximum density differs only by a factor of ~2 between the two runs (about 10 vs. 20 g cm−2). This is consistent with the fact that the inner cavity forms when the PE rate (ṀPE) exceeds the gas inflow rate (Ṁg), the latter approximately given by 3πΣPEv, with ΣPE the threshold gas density when PE dominates. Thus, for disks with given α and ṀpE, ΣPE remains roughly the same4. Yet, both the inward and rebound stages of migration are less pronounced in run-dl than in run-fid (Fig. 7c). In particular, the planet only rebounds from 9 to 9.3 au in run-dl, which is the consequence of the disk dispersing more rapidly and the disk density at the planet’s location decreasing faster.
4.2 Stellar photo-evaporation rate
To study the influence of the PE rate on rebound migration, we conducted simulations with two additional ṀPE values: 6.4 × 10⁻⁹ M⊙ yr−1 (run-pl) and 1.6 × 10⁻⁷ M⊙ yr−1 (run-ph), otherwise using the same parameters as in our fiducial run. The results are presented in the middle row of panels in Fig. 7. There are two main features regarding the disk evolution. First, the threshold surface density required to open an inner cavity is lower in the lower ṀPE disk, implying that the opening of the cavity takes longer than in the higher ṀPE disk (Fig. 7d). Second, once the cavity is formed, the lower ṀPE disk evolves more slowly (Fig. 7e). Rebound migration is notably much reduced in disks with high or low ṀPE, as shown by the comparison between panels c and f in Fig. 7. This can be understood as follows. If PE is very strong, the cavity expands too quickly, the planet cannot respond to the disk evolution fast enough and thus gets left behind as the cavity sweeps out. Conversely, if PE is very weak, the cavity expands too slowly, the timescale for gas removal at the disk edge becomes much longer than the planet’s libration timescale: the corotation torque becomes weaker and outward migration cannot be sustained, making rebound migration impractical. As a result, rebound requires a moderate PE rate to operate effectively.
Let us quantify this more. The libration timescale of the gas in the planet’s horseshoe region is tlib~8πrp/(3Ωrhs). The typical timescale over which the disk in the horseshoe region gets depleted due to the expansion of the cavity is tedge~rhs /υr with υr the expansion rate of the cavity about the planet’s orbital radius. On the one hand, for the corotation torque to be sustained near its maximum value, one needs tedge ≲ tlib/2, which can be recast as
 (6)
(6)
where υK = rΩĸ is the Keplerian velocity and all relevant quantities are calculated at the planet’s orbital radius. On the other hand, as already said, the planet will not be able to surf the expansion of the cavity if the cavity sweeps too fast, which sets an upper limit to υr. The latter can be estimated as the (maximum) migration rate for the planet migration to be driven by the one-sided corotation torque Γc,ls:  , where Γc,ls is given by Eq. (11) in Liu et al. (2017), and qd = ΣPEr2/M★ is the ratio between the local disk mass at the onset of the PE-dominated phase and the stellar mass. The condition υr≲υmig can be recast as
 (7)
(7)
Despite large uncertainties in the above timescale analysis, we can still qualitatively infer from Eqs. (6) and (7) that rebound migration is less likely effective for (i) more massive planets, (ii) disks with a lower surface density at the onset of the PE-dominated phase, and (iii) in disks with larger aspect ratios. The last dependence is examined in the next section.
Combing Eqs. (6) and (7), we estimated the critical planet mass for rebound outward migration as
 (8)
(8)
Figure 8 illustrates how this planet mass varies with radial distance and aspect ratio at given α and ΣPE. The black solid line denotes Mrebound while the colored dashed lines represent the gap opening mass Mgap from Crida et al. (2006), Fung et al. (2014), and Kanagawa et al. (2015), respectively. The intersection region below both the colored and solid lines is expected to be optimal for rebound migration.
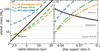 |
Fig. 8 Planet mass vs. radial distance (panel a) and disk aspect ratio (panel b). The solid line represent the critical planet mass for rebound migration based on Eq. (8). The dashed blue, green, and orange lines give the fitting formulas of Crida et al. (2006), Fung et al. (2014), and Kanagawa et al. (2015), who define Mgap as the mass corresponding to 10% and 50% of the gas density at the center gap compared to the unperturbed values. The other parameters are α= 10−3 and ΣPE = 20 × (r/10 au)−1 g/cm−2 at h = 0.05 in panel a and at r= 10 au in panel b. |
4.3 Disk aspect ratio
We also tested the influence of the disk’s aspect ratio by varyin h0 to 0.04 (run-al) and 0.07 (run-ah), again with all other parameters being those of the fiducial run. Results are shown in the bottom row of Fig. 7. In both additional simulations, the inner hole forms at a similar threshold (peak) surface density. However, the lower the aspect ratio, the earlier the cavity forms, and the faster the disk subsequently evolves. This can be explained by considering PE as a competition between gravitational energy, which binds the gas, and thermal energy, which drives the gas outflow. Hence, disks with lower aspect ratios and thus lower temperatures experience faster evaporation. Additionally, the magnitude of the disk torque on the planet increases with decreasing aspect ratio. Combining these two effects, we find in Fig. 7 that the relative magnitude of rebound migration is similar in run-al to that in the fiducial run, while it is much lower in simulation run-ah. In the latter case, the planet undergoes out-ward migration only at the few percent level relative to its initial semimajor axis.
5 Summary and conclusions
In this paper, we have presented the first 2D hydrodynamical simulations of planet-disk interactions that show that outward “rebound” migration can occur near the edge of an expanding cavity in a protoplanetary disk due to PE from the central star. The combined effects of turbulent viscous accretion and stellar PE cause the formation of an inner hole at orbital distances of a few astronomical units. Subsequently, the disk outside the cavity experiences rapid mass loss due to the evaporative wind generated by high-energy stellar radiation. As the gas disk disperses, the inner edge of the disk expands from the inside out. Importantly, a strong positive density gradient builds up along the edge of the cavity, which can largely impact planet migration.
To investigate planet migration under these circumstances, we carried out hydrodynamical simulations with the 2D code Dusty FARGO-ADSG, in which we implemented the effects of stellar X-ray PE. We examined the migration behavior of a single planet with four characteristic masses: super-Earth, Neptune, Saturn, and Jupiter. We analyzed the influence of various disk parameters, such as the disk’s surface density profile, the stellar PE mass-loss rate, and the disk’s aspect ratio.
For the super-Earth and Neptune-mass planets, a large positive corotation torque due to the strong density gradient along the cavity edge is able to sustain substantial outward “rebound” migration. Our 2D hydrodynamical simulations thus confirm the possibility of rebound migration, which was originally proposed and analytically calculated by Liu et al. (2017). The amplitude of rebound migration is found to increase with planet mass and with lower disk aspect ratios, and requires a moderate PE rate. For Saturn-mass planets, however, no rebound migration is observed in our simulations, which we attribute to partial gap depletion lowering the magnitude of the corotation torque. The Jupiter-mass planet can migrate outward along the expanding cavity, which is largely due to the outer disk becoming eccentric. Future work is needed to further investigate rebound migration, in particular for multiple-planet systems in resonant chains with different masses and under various disk conditions.
Data availability
The movies associated to Figs. 1 and 4 are available at https://www.aanda.org
Acknowledgements
We thank the anonymous referee for their useful suggestions. We thank the anonymous referee for their useful suggestions. This work is supported by the National Key R&D Program of China (2024YFA1611803). B.L. acknowledges support from the National Natural Science Foundation of China (Nos. 12222303 and 12173035) and the start-up grant of the Bairen program from Zhejiang University. The simulations and analysis presented in this article were carried out on the SilkRiver Supercomputer and the Qilin computing cluster of Zhejiang University, and on the CALMIP Supercomputing Centre of the University of Toulouse. Y.-P.L. is supported in part by the Natural Science Foundation of China (Grants No. 12373070 and No. 12192223), and the Natural Science Foundation of Shanghai (Grant No. 23ZR1473700).
References
- Alexander, R. D., Clarke, C. J., & Pringle, J. E. 2006, MNRAS, 369, 229 [CrossRef] [Google Scholar]
- Alexander, R., Pascucci, I., Andrews, S., Armitage, P., & Cieza, L. 2014, Protostars and Planets VI, 475 [Google Scholar]
- Aoyama, Y., & Bai, X.-N. 2023, ApJ, 946, 5 [NASA ADS] [CrossRef] [Google Scholar]
- Arzamasskiy, L., Zhu, Z., & Stone, J. M. 2018, MNRAS, 475, 3201 [NASA ADS] [CrossRef] [Google Scholar]
- Ataiee, S., Pinilla, P., Zsom, A., et al. 2013, A&A, 553, L3 [NASA ADS] [CrossRef] [EDP Sciences] [Google Scholar]
- Bae, J., Hartmann, L., Zhu, Z., & Gammie, C. 2013, ApJ, 774, 57 [NASA ADS] [CrossRef] [Google Scholar]
- Bai, X.-N., Ye, J., Goodman, J., & Yuan, F. 2016, ApJ, 818, 152 [Google Scholar]
- Baruteau, C., & Masset, F. 2008, ApJ, 672, 1054 [CrossRef] [Google Scholar]
- Baruteau, C., & Masset, F. 2013, in Lecture Notes in Physics, 861, eds. J. Souchay, S. Mathis, & T. Tokieda (Berlin: Springer Verlag), 201 [Google Scholar]
- Baruteau, C., Crida, A., Paardekooper, S.-J., et al. 2014, Protostars and Planets VI, 667 [Google Scholar]
- Benítez-Llambay, P., Masset, F., Koenigsberger, G., & Szulágyi, J. 2015, Nature, 520, 63 [Google Scholar]
- Chen, Y.-X., Zhang, X., Li, Y.-P., Li, H., & Lin, D. N. C. 2020, ApJ, 900, 44 [NASA ADS] [CrossRef] [Google Scholar]
- Cimerman, N. P., Rafikov, R. R., & Miranda, R. 2024, MNRAS, 529, 425 [Google Scholar]
- Crida, A., Morbidelli, A., & Masset, F. 2006, Icarus, 181, 587 [Google Scholar]
- Crida, A., Baruteau, C., Griveaud, P., et al. 2025, Open J. Astrophys., 8, 84 [Google Scholar]
- Debras, F., Baruteau, C., & Donati, J.-F. 2021, MNRAS, 500, 1621 [Google Scholar]
- Dempsey, A. M., Lee, W.-K., & Lithwick, Y. 2020, ApJ, 891, 108 [Google Scholar]
- Dempsey, A. M., Muñoz, D. J., & Lithwick, Y. 2021, ApJ, 918, L36 [CrossRef] [Google Scholar]
- Dong, R., Zhu, Z., & Whitney, B. 2015, ApJ, 809, 93 [NASA ADS] [CrossRef] [Google Scholar]
- Dürmann, C., & Kley, W. 2015, A&A, 574, A52 [NASA ADS] [CrossRef] [EDP Sciences] [Google Scholar]
- Ercolano, B., & Pascucci, I. 2017, Roy. Soc. Open Sci., 4, 170114 [Google Scholar]
- Fabrycky, D. C., Lissauer, J. J., Ragozzine, D., et al. 2014, ApJ, 790, 146 [Google Scholar]
- Fung, J., Shi, J.-M., & Chiang, E. 2014, ApJ, 782, 88 [NASA ADS] [CrossRef] [Google Scholar]
- Goldreich, P., & Tremaine, S. 1980, ApJ, 241, 425 [Google Scholar]
- Hansen, B. M. S., Yu, T.-Y., & Hasegawa, Y. 2024, Open J. Astrophys., 7, 61 [Google Scholar]
- Hu, X., Zhu, Z., Tan, J. C., & Chatterjee, S. 2016, ApJ, 816, 19 [Google Scholar]
- Huang, S., & Ormel, C. W. 2022, MNRAS, 511, 3814 [NASA ADS] [CrossRef] [Google Scholar]
- Ida, S., Lin, D. N. C., & Nagasawa, M. 2013, ApJ, 775, 42 [Google Scholar]
- Kanagawa, K. D., Muto, T., Tanaka, H., et al. 2015, ApJ, 806, L15 [NASA ADS] [CrossRef] [Google Scholar]
- Kanagawa, K. D., Tanaka, H., & Szuszkiewicz, E. 2018, ApJ, 861, 140 [Google Scholar]
- Kley, W., & Dirksen, G. 2006, A&A, 447, 369 [NASA ADS] [CrossRef] [EDP Sciences] [Google Scholar]
- Kley, W., & Nelson, R. P. 2012, ARA&A, 50, 211 [Google Scholar]
- Koenigl, A. 1991, ApJ, 370, L39 [Google Scholar]
- Kunitomo, M., Ida, S., Takeuchi, T., et al. 2021, ApJ, 909, 109 [NASA ADS] [CrossRef] [Google Scholar]
- Li, Y.-P., Chen, Y.-X., Lin, D. N. C., & Zhang, X. 2021, ApJ, 906, 52 [NASA ADS] [CrossRef] [Google Scholar]
- Li, Y.-P., Chen, Y.-X., & Lin, D. N. C. 2023, MNRAS, 526, 5346 [NASA ADS] [CrossRef] [Google Scholar]
- Li, Y.-P., Chen, Y.-X., & Lin, D. N. C. 2024, ApJ, 971, 130 [Google Scholar]
- Lin, D. N. C., Bodenheimer, P., & Richardson, D. C. 1996, Nature, 380, 606 [Google Scholar]
- Lin, D. N. C., & Papaloizou, J. 1986, ApJ, 309, 846 [Google Scholar]
- Lin, D. N. C., & Papaloizou, J. C. B. 1993, in Protostars and Planets III, eds. E. H. Levy & J. I. Lunine, 749 [Google Scholar]
- Liu, B., & Ormel, C. W. 2017, A&A, 606, A66 [NASA ADS] [CrossRef] [EDP Sciences] [Google Scholar]
- Liu, B., Ormel, C. W., & Lin, D. N. C. 2017, A&A, 601, A15 [NASA ADS] [CrossRef] [EDP Sciences] [Google Scholar]
- Liu, B., Raymond, S. N., & Jacobson, S. A. 2022, Nature, 604, 643 [NASA ADS] [CrossRef] [Google Scholar]
- Lubow, S. H., & D’Angelo, G. 2006, ApJ, 641, 526 [Google Scholar]
- Masset, F. 2000, A&AS, 141, 165 [NASA ADS] [CrossRef] [EDP Sciences] [Google Scholar]
- Masset, F. S., & Papaloizou, J. C. B. 2003, ApJ, 588, 494 [NASA ADS] [CrossRef] [Google Scholar]
- Masset, F. S., Morbidelli, A., Crida, A., & Ferreira, J. 2006, ApJ, 642, 478 [Google Scholar]
- McNally, C. P., Nelson, R. P., Paardekooper, S.-J., & Benítez-Llambay, P. 2019, MNRAS, 484, 728 [Google Scholar]
- Miranda, R., & Lai, D. 2018, MNRAS, 473, 5267 [Google Scholar]
- Monsch, K., Picogna, G., Ercolano, B., & Kley, W. 2021, A&A, 646, A169 [NASA ADS] [CrossRef] [EDP Sciences] [Google Scholar]
- Nelson, R. P., Papaloizou, J. C. B., Masset, F., & Kley, W. 2000, MNRAS, 318, 18 [NASA ADS] [CrossRef] [Google Scholar]
- Owen, J. E., Ercolano, B., & Clarke, C. J. 2011, MNRAS, 412, 13 [Google Scholar]
- Owen, J. E., Clarke, C. J., & Ercolano, B. 2012, MNRAS, 422, 1880 [Google Scholar]
- Paardekooper, S.-J., Baruteau, C., Crida, A., & Kley, W. 2010, MNRAS, 401, 1950 [NASA ADS] [CrossRef] [Google Scholar]
- Paardekooper, S.-J., Baruteau, C., & Kley, W. 2011, MNRAS, 410, 293 [NASA ADS] [CrossRef] [Google Scholar]
- Paardekooper, S., Dong, R., Duffell, P., et al. 2023, in Astronomical Society of the Pacific Conference Series, 534, Protostars and Planets VII, eds. S. Inutsuka, Y. Aikawa, T. Muto, K. Tomida, & M. Tamura, 685 [Google Scholar]
- Pan, M., Izidoro, A., & Shibata, S. 2025, arXiv e-prints [arXiv:2509.07866] [Google Scholar]
- Peplinski, A., Artymowicz, P., & Mellema, G. 2008, MNRAS, 387, 1063 [CrossRef] [Google Scholar]
- Picogna, G., Ercolano, B., Owen, J. E., & Weber, M. L. 2019, MNRAS, 487, 691 [Google Scholar]
- Picogna, G., Ercolano, B., & Espaillat, C. C. 2021, MNRAS, 508, 3611 [NASA ADS] [CrossRef] [Google Scholar]
- Rafikov, R. R., & Petrovich, C. 2012, ApJ, 747, 24 [Google Scholar]
- Robert, C. M. T., Crida, A., Lega, E., Méheut, H., & Morbidelli, A. 2018, A&A, 617, A98 [NASA ADS] [CrossRef] [EDP Sciences] [Google Scholar]
- Romanova, M. M., Lii, P. S., Koldoba, A. V., et al. 2019, MNRAS, 485, 2666 [Google Scholar]
- Romanova, M. M., Ustyugova, G. V., Koldoba, A. V., Wick, J. V., & Lovelace, R. V. E. 2003, ApJ, 595, 1009 [Google Scholar]
- Romanova, M. M., Koldoba, A. V., Ustyugova, G. V., Espaillat, C. C., & Lovelace, R. V. E. 2025, arXiv e-prints [arXiv:2507.15115] [Google Scholar]
- Rosotti, G. P., Ercolano, B., Owen, J. E., & Armitage, P. J. 2013, MNRAS, 430, 1392 [Google Scholar]
- Tanaka, H., Takeuchi, T., & Ward, W. R. 2002, ApJ, 565, 1257 [Google Scholar]
- Teyssandier, J., & Ogilvie, G. I. 2017, MNRAS, 467, 4577 [NASA ADS] [CrossRef] [Google Scholar]
- Wang, L., & Goodman, J. 2017, ApJ, 847, 11 [Google Scholar]
- Ward, W. R. 1997, Icarus, 126, 261 [Google Scholar]
- Wu, Y., Chen, Y.-X., & Lin, D. N. C. 2024, MNRAS, 528, L127 [Google Scholar]
- Zhu, Z. 2025, MNRAS, 537, 3701 [Google Scholar]
- Zhu, Z., Stone, J. M., & Calvet, N. 2024, MNRAS, 528, 2883 [NASA ADS] [CrossRef] [Google Scholar]
While magnetized winds can also drive disk angular momentum transport (Bai et al. 2016), we emphasize that such wind-driven planet migration - being strongly dependent on poloidal magnetic flux (Aoyama & Bai 2023) – represents a different regime from what we focus on in this work.
We note that the outcomes depend on the PE models. For instance, for the same stellar X-ray luminosity, the Picogna et al. (2019) profile yields a higher  in the outer disk region and an overall higher integrated mass-loss rate. This leads to faster disk dispersal and planet outward migration less likely.
It is well possible that the planet would have further migrated outward if we had continued the simulation. However, after having consumed 100 000 core hours of computational resources, the planet evolution proceeded at an extremely slow rate and we manually terminated the simulation at t = 5 × 10⁴ P0.
This also means that as long as Σ0>ΣPE, varying the initial disk density has little effect on the disk evolution and planet migration in the PE-dominated phase.
All Tables
All Figures
|
Fig. 1 Migration of a Neptune-mass planet (panel a) and disk surface density evolution (panel b) in simulation run-fid. In panel a. the solid curve shows the time evolution of the planet’s semimajor axis. The gray circle marks the planet position at the time shown in Figs. 2 and 3. The planet undergoes a reversal in migration direction (termed “rebound migration”) as the inner photo-evaporative cavity expands from the inside out. The video can be downloaded from: https://github.com/bbliu-astro/movies/blob/main/hydrodynamic_rebound/Neptune.gif and online. |
| In the text | |
|
Fig. 2 Surface density perturbation of |
| In the text | |
|
Fig. 3 Inverse vortensity (ζ) close to the planet in the r−ϕ frame (panel a) and surface density profile and corotation torque components (panel b) in run-fid for a Neptune-mass planet at t = 3.5 × 10⁴ P0. In both panels, the width between the vertical dashed lines is 2 max(rH, rhs). The asymmetric ζ distribution between the upper and lower parts of the horseshoe region results in a strong, positive corotation torque. |
| In the text | |
|
Fig. 4 Evolution of the semimajor axis (top) and disk surface density (bottom) in simulations run-fid for a super-Earth planet of 3 M⊕ (left), a Saturn-mass planet (middle), and a Jupiter-mass planet (right). In the upper panels the gray circles mark the planet’s position used in Fig. 5, and the cyan area in the top-right panel shows the radial extent between the planet’s pericenter and apocenter. The video can be downloaded from: https://github.com/bbliu-astro/movies/blob/main/hydrodynamic_rebound/superEarth.gif and online. |
| In the text | |
|
Fig. 5 Surface density perturbation of |
| In the text | |
|
Fig. 6 Azimuthally averaged radial distribution of the disk eccentricity at the same times as in Figs. 2 and 5. The filled circles show the planet’s location in each simulation. The dashed curves indicate the gas-depleted cavity region, where the calculation of the gas eccentricity is strongly affected by the reset in the gas density. The Jupiter-mass planet excites a large eccentricity in its outer disk, in contrast to the three less massive planets. |
| In the text | |
|
Fig. 7 Time evolution of the surface density profile of the disk (left panels), its mass (middle, black circles), the cavity’s expansion rate (middle, blue circles), and the semimajor axis of a Neptune-mass planet (right). All results are shown in the PE-dominated disk phase. The planet is released at different times throughout the simulations. The three rows of panels correspond to runs with different: slopes of the disk’s initial surface density profile (1), PE mass-loss rates (2), and disk aspect ratios (3; see Table 2). The thick solid and thin dashed curves across the panels show results for run-fid and run-Id in the top row, run-ph and run-pl in the middle row, and run-al and run-ah in the bottom row. |
| In the text | |
|
Fig. 8 Planet mass vs. radial distance (panel a) and disk aspect ratio (panel b). The solid line represent the critical planet mass for rebound migration based on Eq. (8). The dashed blue, green, and orange lines give the fitting formulas of Crida et al. (2006), Fung et al. (2014), and Kanagawa et al. (2015), who define Mgap as the mass corresponding to 10% and 50% of the gas density at the center gap compared to the unperturbed values. The other parameters are α= 10−3 and ΣPE = 20 × (r/10 au)−1 g/cm−2 at h = 0.05 in panel a and at r= 10 au in panel b. |
| In the text | |
Current usage metrics show cumulative count of Article Views (full-text article views including HTML views, PDF and ePub downloads, according to the available data) and Abstracts Views on Vision4Press platform.
Data correspond to usage on the plateform after 2015. The current usage metrics is available 48-96 hours after online publication and is updated daily on week days.
Initial download of the metrics may take a while.