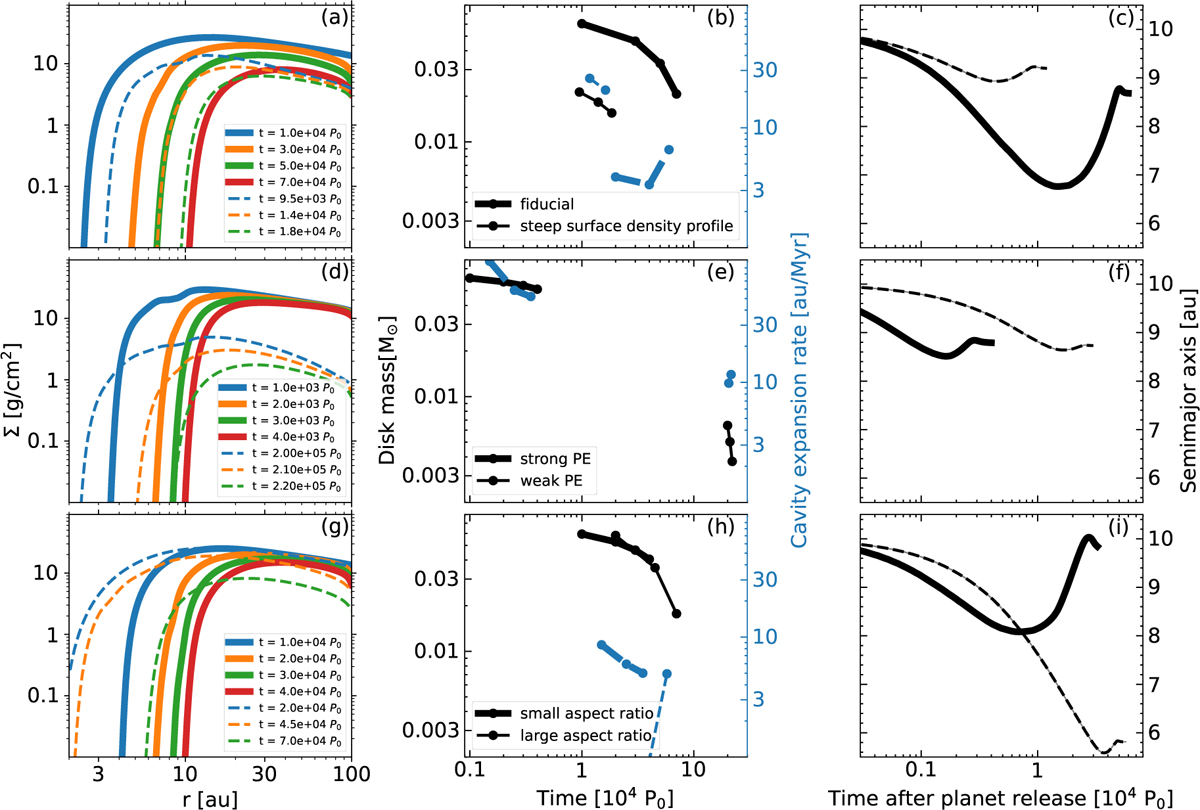
Fig. 7
Download original image
Time evolution of the surface density profile of the disk (left panels), its mass (middle, black circles), the cavity’s expansion rate (middle, blue circles), and the semimajor axis of a Neptune-mass planet (right). All results are shown in the PE-dominated disk phase. The planet is released at different times throughout the simulations. The three rows of panels correspond to runs with different: slopes of the disk’s initial surface density profile (1), PE mass-loss rates (2), and disk aspect ratios (3; see Table 2). The thick solid and thin dashed curves across the panels show results for run-fid and run-Id in the top row, run-ph and run-pl in the middle row, and run-al and run-ah in the bottom row.
Current usage metrics show cumulative count of Article Views (full-text article views including HTML views, PDF and ePub downloads, according to the available data) and Abstracts Views on Vision4Press platform.
Data correspond to usage on the plateform after 2015. The current usage metrics is available 48-96 hours after online publication and is updated daily on week days.
Initial download of the metrics may take a while.