Fig. 1
Download original image
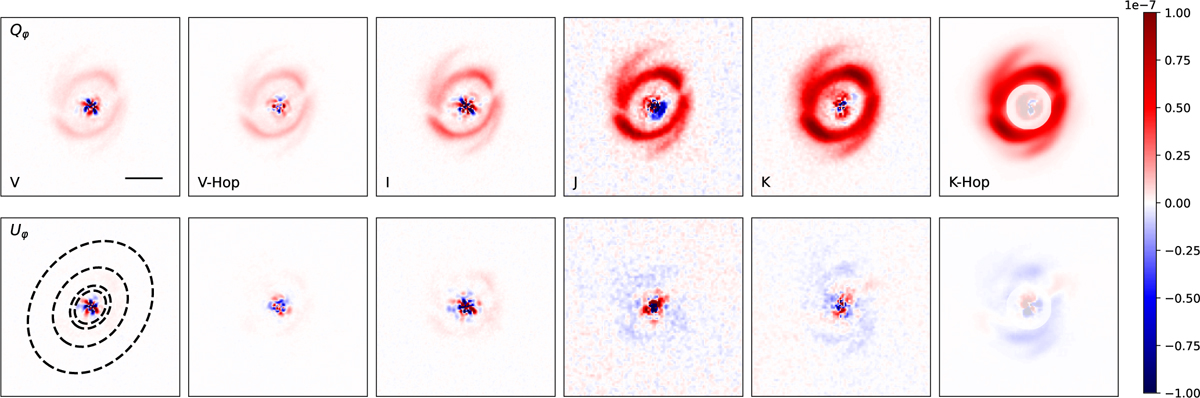
Polarized intensity images Qφ(x,y) and Uφ(x,y) for V, I′, J, and Ks band. All images are normalized to the integrated stellar intensity I★ and their pixel scale (3.6 × 3.6 mas2 for ZIMPOL and 12.25 × 12.25 mas2 for IRDIS). The shared color bar is indicated on the right. All the images are cut to 1.0 × 1.0″ and the black bar in Qφ(V) indicates 0.2″. The dashed lines in Uφ(V) enclose the integration region for the cavity, the rim, and the spiral respectively. The semitransparent circle in K-hop represents the inner working angle (IWA) = 0.125″ limited by the coronagraph. North is up and east to the left.
Current usage metrics show cumulative count of Article Views (full-text article views including HTML views, PDF and ePub downloads, according to the available data) and Abstracts Views on Vision4Press platform.
Data correspond to usage on the plateform after 2015. The current usage metrics is available 48-96 hours after online publication and is updated daily on week days.
Initial download of the metrics may take a while.