Open Access
Fig. A.2
Download original image
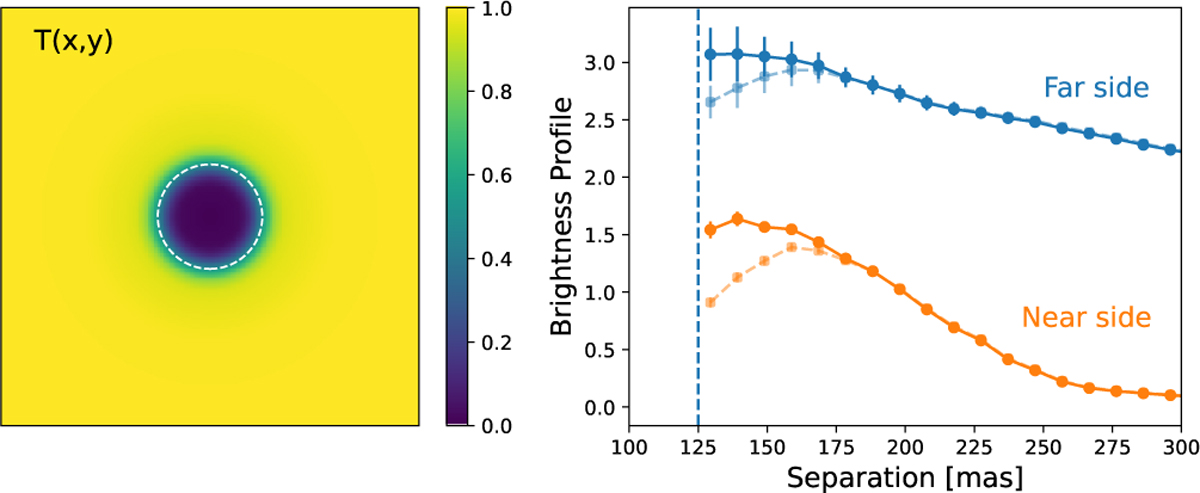
Coronagraph N_ALC_Ks transmission correction. Left: Transmission map T(x, y) of coronagraph N_ALC_Ks zoomed to 1×1″. Right: Radial profile of the total disk intensity Idisk(r) for the near and far sides. The dashed and solid lines represent the profiles before and after the correction respectively.
Current usage metrics show cumulative count of Article Views (full-text article views including HTML views, PDF and ePub downloads, according to the available data) and Abstracts Views on Vision4Press platform.
Data correspond to usage on the plateform after 2015. The current usage metrics is available 48-96 hours after online publication and is updated daily on week days.
Initial download of the metrics may take a while.