Fig. B.1
Download original image
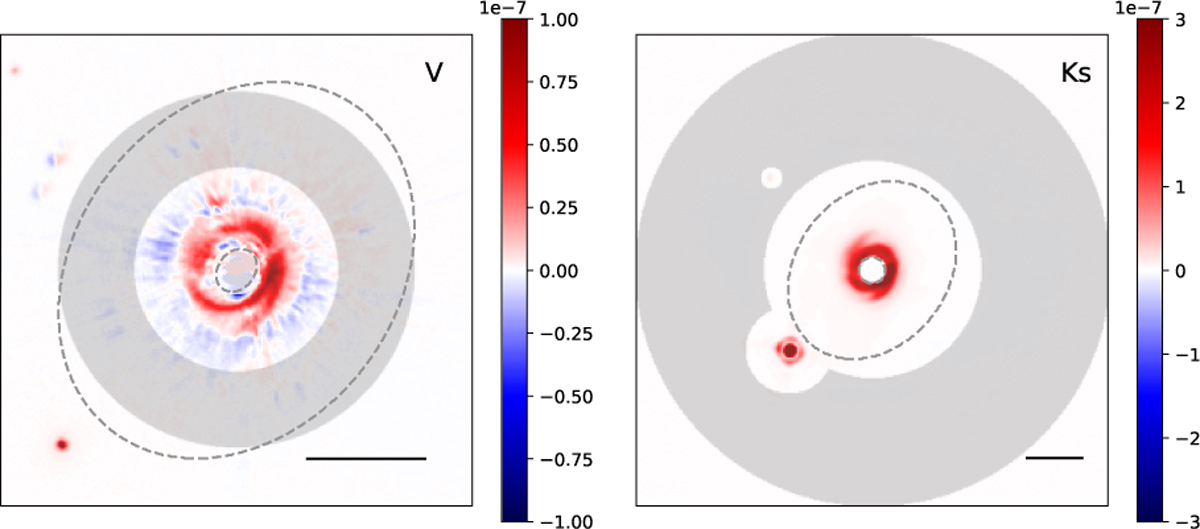
Fitting region, Σ, used for disk intensity extraction. Left: Fitting region at V-band. The gray shaded annulus indicates Σ, overplotted on Idisk(x, y)(V) extracted without introducing halo component. Right: Fitting region at Ks band. The gray shaded region indicates Σ at Ks-band, overplotted on Idisk(x, y)(K) extracted using NMF_imaging with improved Σ. The two images are shown in different scales to highlight the Σ, with the black bar indicating 0.5″. The gray dashed lines encloses the region for disk intensity integration.
Current usage metrics show cumulative count of Article Views (full-text article views including HTML views, PDF and ePub downloads, according to the available data) and Abstracts Views on Vision4Press platform.
Data correspond to usage on the plateform after 2015. The current usage metrics is available 48-96 hours after online publication and is updated daily on week days.
Initial download of the metrics may take a while.