Open Access
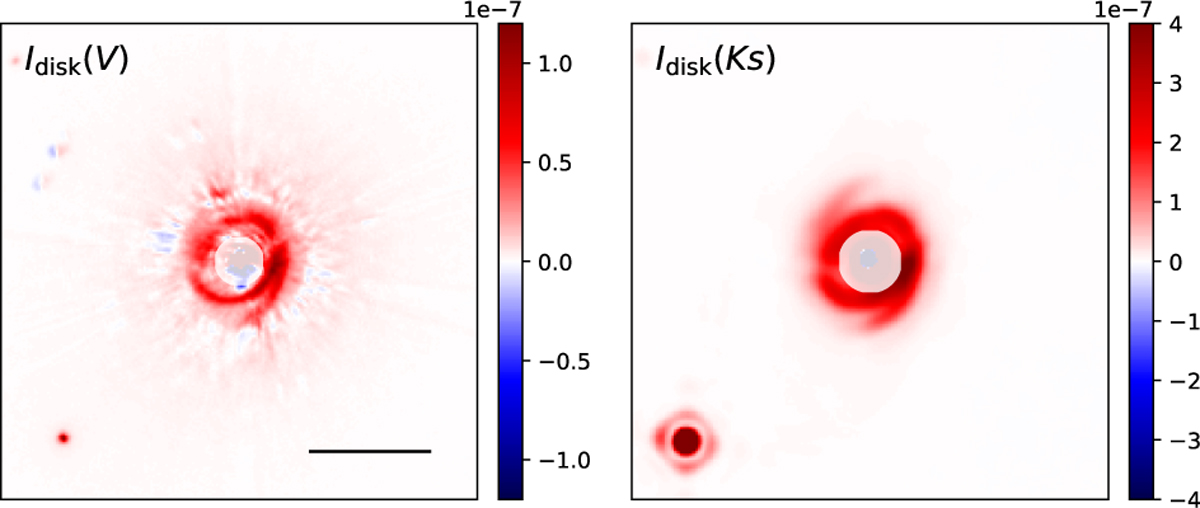
Fig. 3
Download original image
Extracted disk intensity map Idisk(x, y) for the V- and Ks-bands, cut to 2.0 × 2.0″. The black bar indicates 0.5″. The central 0.1″ and 0.125″ are masked out as the IWA for V and Ks respectively.
Current usage metrics show cumulative count of Article Views (full-text article views including HTML views, PDF and ePub downloads, according to the available data) and Abstracts Views on Vision4Press platform.
Data correspond to usage on the plateform after 2015. The current usage metrics is available 48-96 hours after online publication and is updated daily on week days.
Initial download of the metrics may take a while.