Fig. 5
Download original image
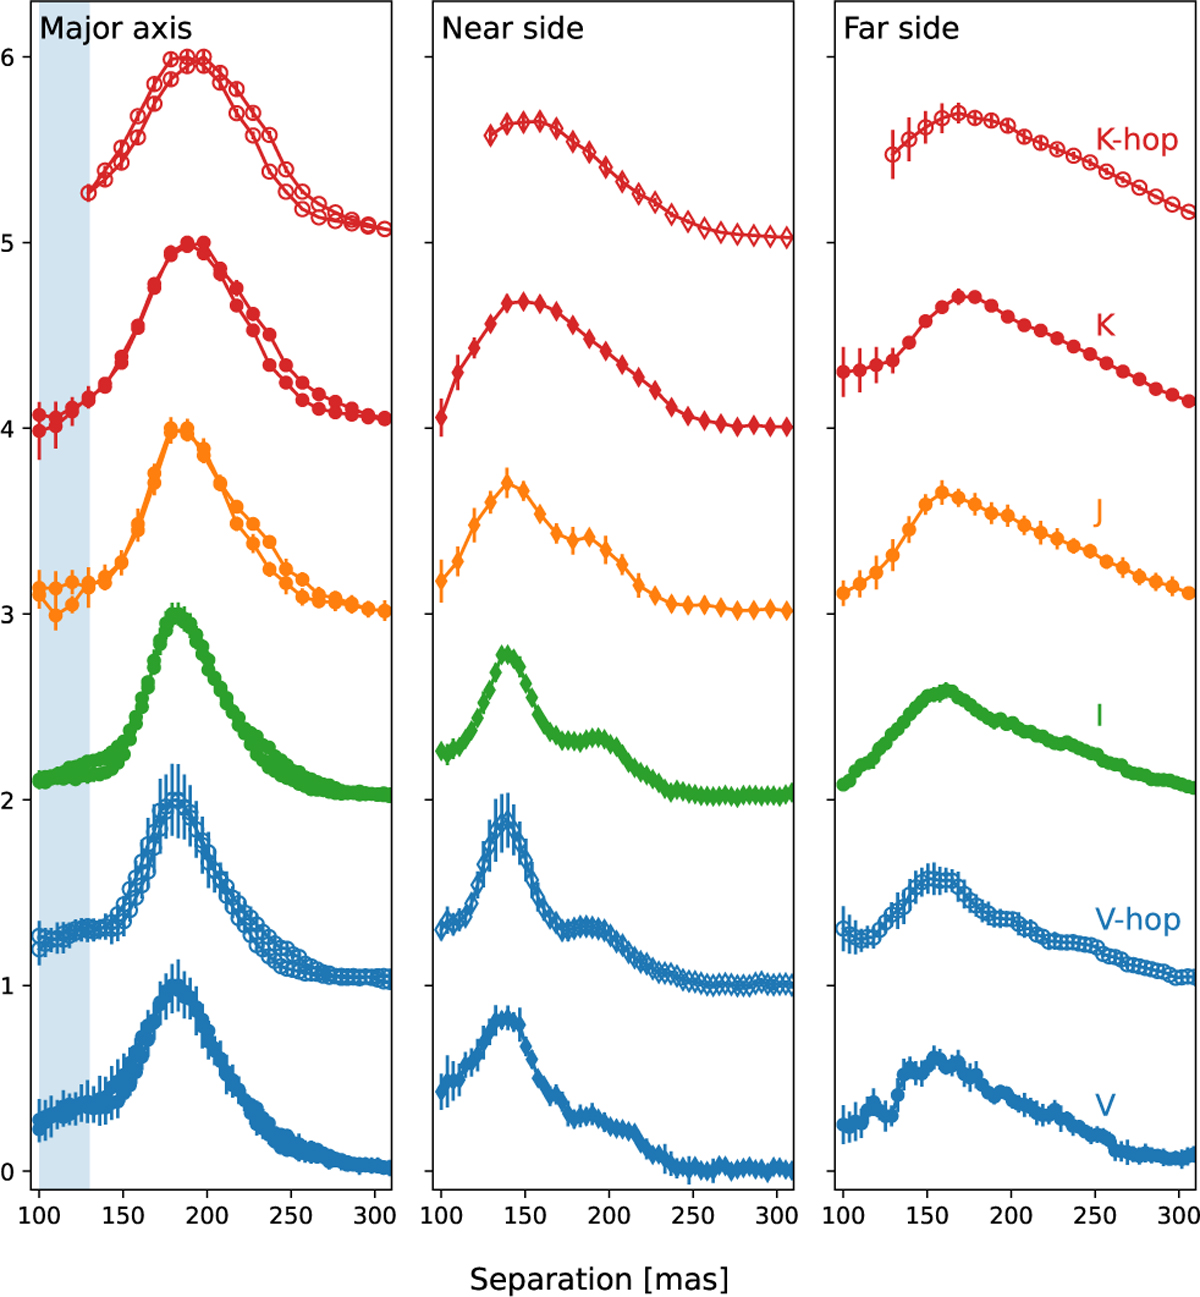
Radial profiles of polarized intensity Qφ(r) along both sides of the major axis (left), near side (middle), and far side (right). All profiles have been normalized to the peak value along the major axis and shifted by one for clarity. The standard deviation among all cycles at a given epoch is indicated as the error bar. The shaded region indicates the cavity region [0.10, 0.13]″.
Current usage metrics show cumulative count of Article Views (full-text article views including HTML views, PDF and ePub downloads, according to the available data) and Abstracts Views on Vision4Press platform.
Data correspond to usage on the plateform after 2015. The current usage metrics is available 48-96 hours after online publication and is updated daily on week days.
Initial download of the metrics may take a while.