Fig. 7
Download original image
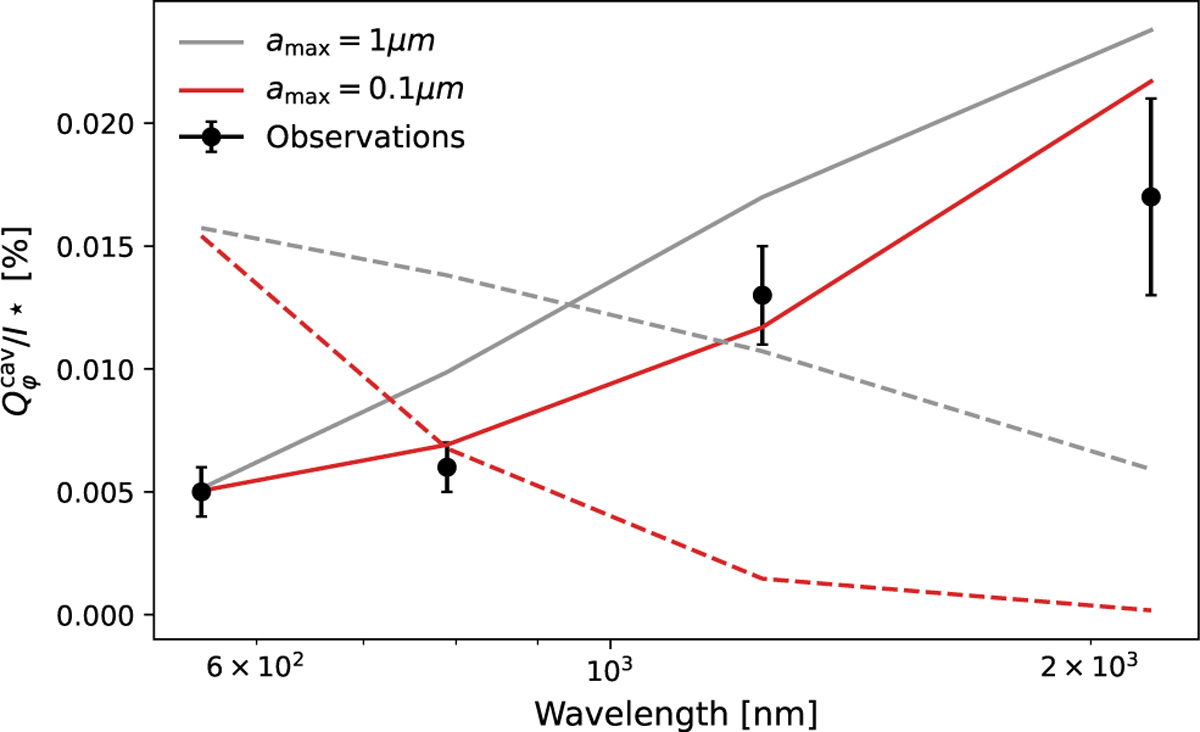
Polarized flux integrated in the cavity region ![]() . The black scatter points are measurements from observations (Table 2). The solid gray and red lines are the contrasts measured from convolved simulations assuming DIANA amax = 1 and 0.1 μm in the cavity respectively. The dashed gray and red lines are measured from simulations before convolution.
. The black scatter points are measurements from observations (Table 2). The solid gray and red lines are the contrasts measured from convolved simulations assuming DIANA amax = 1 and 0.1 μm in the cavity respectively. The dashed gray and red lines are measured from simulations before convolution.
Current usage metrics show cumulative count of Article Views (full-text article views including HTML views, PDF and ePub downloads, according to the available data) and Abstracts Views on Vision4Press platform.
Data correspond to usage on the plateform after 2015. The current usage metrics is available 48-96 hours after online publication and is updated daily on week days.
Initial download of the metrics may take a while.