Fig. 8
Download original image
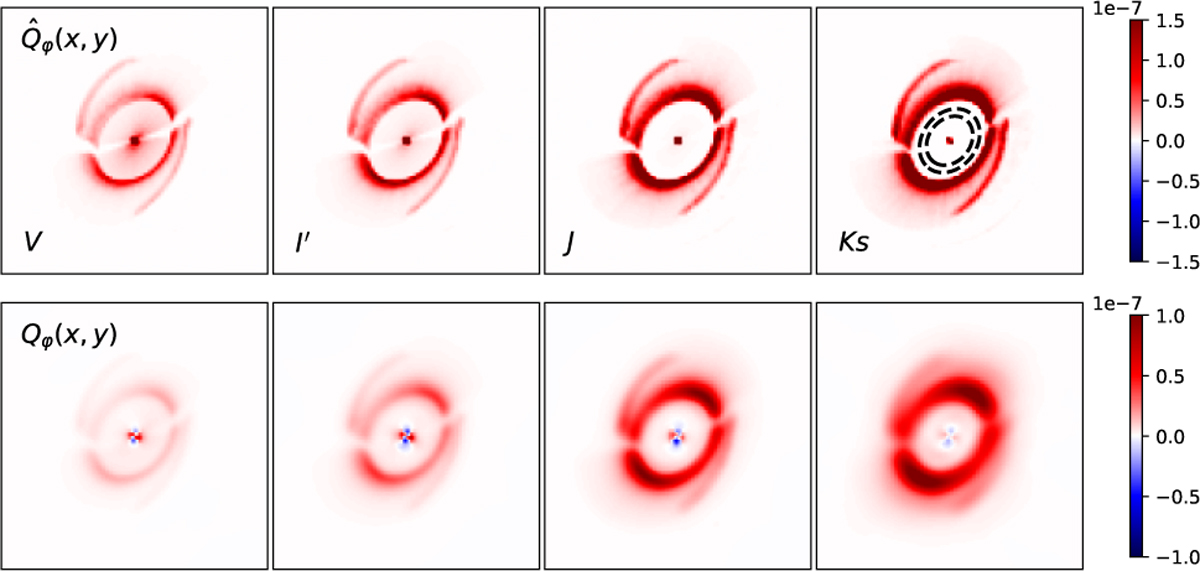
Simulated polarized intensity maps in Setup C. Top row: intrinsic ![]() without convolution. Bottom row: Qφ(x, y) after convolution with the corresponding PSF at V, I′, J, and Ks. The dust parameters in the outer disk are taken from Table 4. The inner disk and cavity assume DIANA dust with amax = 0.1 μm. The dashed lines in
without convolution. Bottom row: Qφ(x, y) after convolution with the corresponding PSF at V, I′, J, and Ks. The dust parameters in the outer disk are taken from Table 4. The inner disk and cavity assume DIANA dust with amax = 0.1 μm. The dashed lines in ![]() -image at Ks band encloses the cavity region.
-image at Ks band encloses the cavity region.
Current usage metrics show cumulative count of Article Views (full-text article views including HTML views, PDF and ePub downloads, according to the available data) and Abstracts Views on Vision4Press platform.
Data correspond to usage on the plateform after 2015. The current usage metrics is available 48-96 hours after online publication and is updated daily on week days.
Initial download of the metrics may take a while.