Fig. 3
Download original image
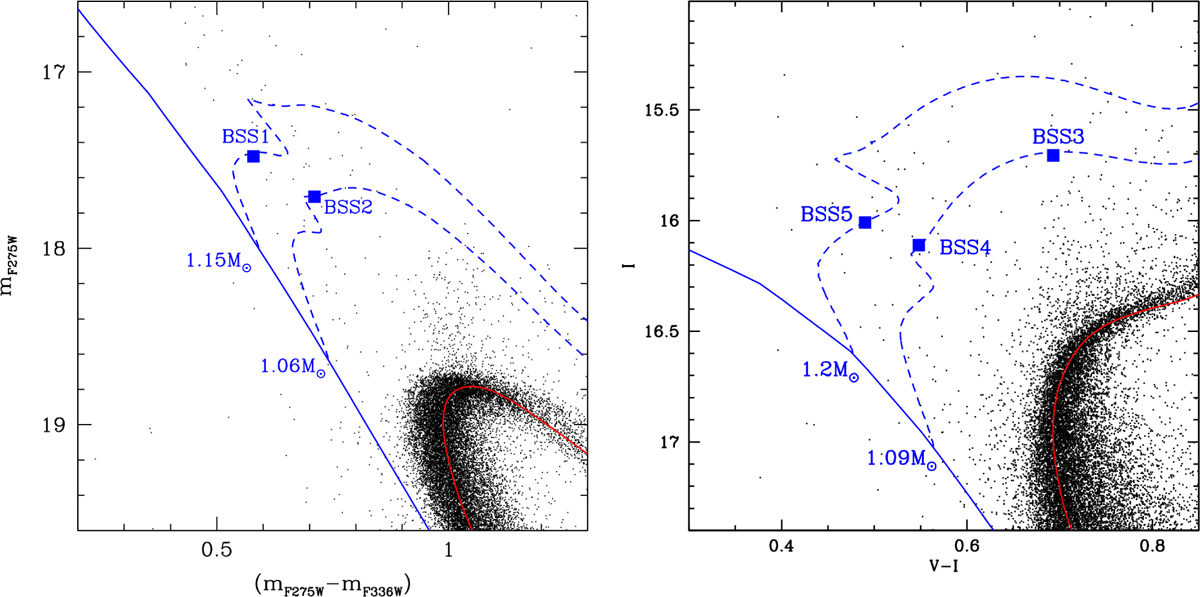
Near-UV CMD (left panel) and optical CMD (right panel) of 47 Tucanae with the five targets of this study highlighted as blue squares. The 12 Gyr BaSTI (Pietrinferni et al. 2021) isochrone, which reproduces the MS-TO region well, is shown in both CMDs as a red line. The corresponding 40 Myr isochrone, assumed to be representative of the zero-age MS location, is plotted as a solid blue line. The dashed blue lines are the evolutionary tracks that best reproduce the observed positions of the targets in these CMDs.
Current usage metrics show cumulative count of Article Views (full-text article views including HTML views, PDF and ePub downloads, according to the available data) and Abstracts Views on Vision4Press platform.
Data correspond to usage on the plateform after 2015. The current usage metrics is available 48-96 hours after online publication and is updated daily on week days.
Initial download of the metrics may take a while.