Fig. 4
Download original image
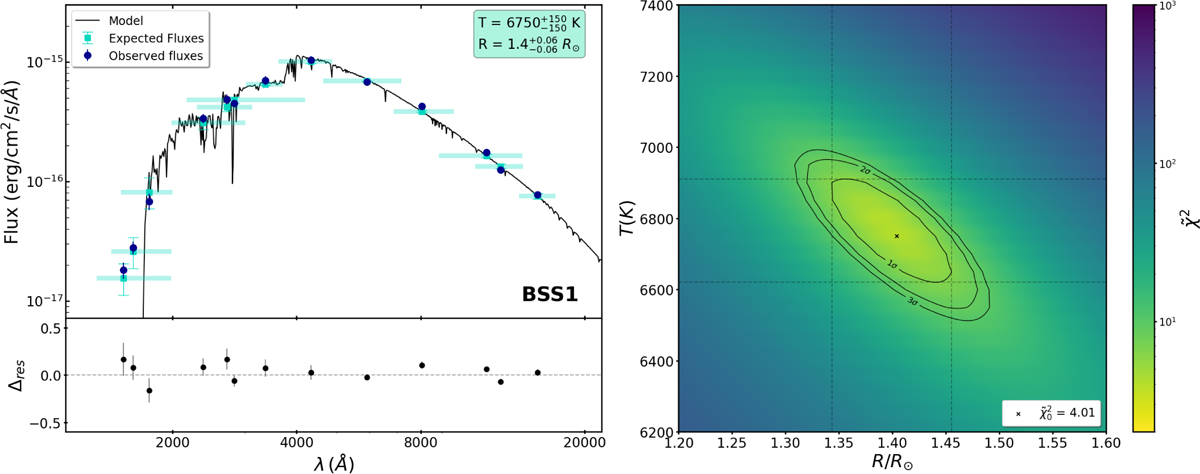
Left panel : observed SED of BSS1 (blue circles) compared to expected fluxes (cyan squares) computed from the convolution of the best-fit synthetic SED (black line) with the adopted photometric filters. The uncertainties on the observed fluxes are marked with vertical error bars (unless they are smaller than the size of the blue circles). The horizontal cyan-shaded rectangles mark the wavelength width of each photometric filter. For the sake of clarity, they are associated with the expected fluxes only but, of course, they also hold for the observed points. The vertical error bar of the cyan squares corresponds to the 1σ error on the expected fluxes. The best-fit surface temperature and radius are labelled together with their 1σ uncertainty in the top-right corner legend. The residuals between the observed and the expected fluxes are plotted in the lower panel. Right panel : χ2 map for BSS1 showing the distribution of χ2 values (colour-coded as in the side bar) obtained for all the explored combinations of R and T. The black lines refer to the 1σ, 2σ and 3σ χ2 contours from the minimum values (![]() ), which is marked with a black cross and labelled in the bottom-right corner.
), which is marked with a black cross and labelled in the bottom-right corner.
Current usage metrics show cumulative count of Article Views (full-text article views including HTML views, PDF and ePub downloads, according to the available data) and Abstracts Views on Vision4Press platform.
Data correspond to usage on the plateform after 2015. The current usage metrics is available 48-96 hours after online publication and is updated daily on week days.
Initial download of the metrics may take a while.