Fig. 6
Download original image
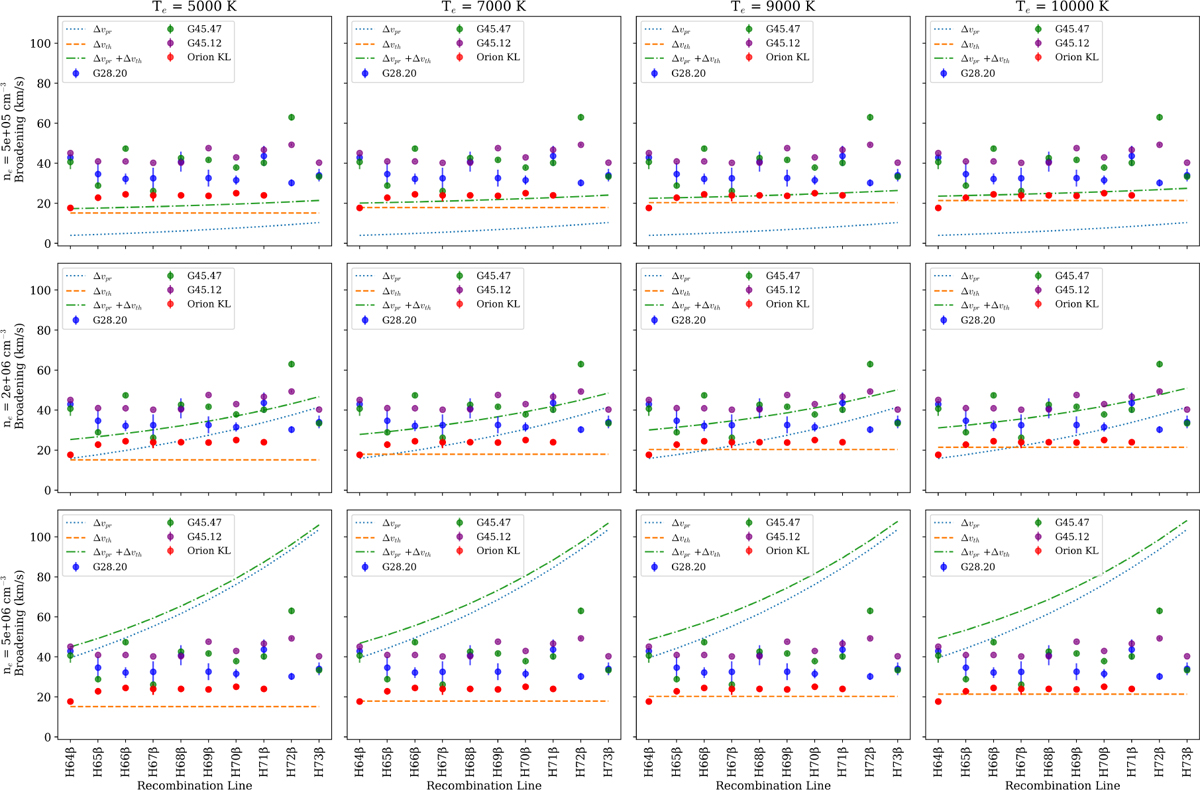
Comparison between observed and theoretical line widths of Hβ lines for different electron density and temperature. The dotted blue line represents the contribution from pressure broadening, the dashed orange line represents the thermal broadening, and the dash-dotted green line depicts the combined contribution from thermal and pressure broadening. Line width data of Orion KL are taken from (Liu et al. 2022).
Current usage metrics show cumulative count of Article Views (full-text article views including HTML views, PDF and ePub downloads, according to the available data) and Abstracts Views on Vision4Press platform.
Data correspond to usage on the plateform after 2015. The current usage metrics is available 48-96 hours after online publication and is updated daily on week days.
Initial download of the metrics may take a while.