| Issue |
A&A
Volume 702, October 2025
|
|
|---|---|---|
| Article Number | A107 | |
| Number of page(s) | 11 | |
| Section | Interstellar and circumstellar matter | |
| DOI | https://doi.org/10.1051/0004-6361/202556220 | |
| Published online | 13 October 2025 | |
The SOFIA Massive (SOMA) star formation Q-band follow-up
II. Hydrogen recombination lines towards high-mass protostars
1
Rosseland Centre for Solar Physics, University of Oslo,
PO Box 1029
Blindern,
0315
Oslo,
Norway
2
Institute of Theoretical Astrophysics, University of Oslo,
PO Box 1029
Blindern,
0315
Oslo,
Norway
3
National Astronomical Observatory of Japan, National Institutes of Natural Sciences,
2-21-1 Osawa,
Mitaka,
Tokyo
181-8588,
Japan
4
Department of Space, Earth & Environment, Chalmers University of Technology,
412 93
Gothenburg,
Sweden
5
Department of Astronomy, University of Virginia,
Charlottesville,
VA
22904,
USA
6
Observatorio Astronomico Nacional (OAN-IGN),
Alfonso XII 3,
28014
Madrid,
Spain
7
Division of Physics, Mathematics, and Astronomy, California Institute of Technology,
Pasadena,
CA
91125,
USA
8
Centro de Astrobiologia (CAB), CSIC-INTA,
Ctra. de Ajalvir km 4,
Torrejon de Ardoz
28806,
Spain
9
Department of Astronomy, Shanghai Jiao Tong University,
800 Dongchuan Rd.,
Minhang,
Shanghai
200240,
PR China
10
Institut de Radioastronomie Millimétrique,
300 Rue de la Piscine,
38400
Saint-Martin-d’Hères,
France
11
Osservatorio Astrofisico di Arcetri,
Largo Enrico Fermi, 5,
50125
Firenze,
FI,
Italy
12
Instituto de Astrofísica de Andalucía, CSIC,
Glorieta de la Astronomía s/n,
18008
Granada,
Spain
13
Departament de Física Quàntica i Astrofísica (FQA), Universitat de Barcelona (UB),
Martí i Franquès 1,
08028
Barcelona,
Spain
14
Institut de Ciències del Cosmos (ICCUB), Universitat de Barcelona (UB),
Martí i Franquès 1,
08028
Barcelona,
Spain
15
Institut dÉstudis Espacials de Catalunya (IEEC), Esteve Terradas 1, edifici RDIT, Parc Mediterrani de la Tecnologia (PMT) Campus del Baix Llobregat – UPC,
Spain
16
Faculty of Physics, University of Duisburg-Essen,
Lotharstraße 1,
47057
Duisburg,
Germany
17
Institute of Astronomy Space and Earth Sciences,
P 177, CIT Road, Scheme 7m,
Kolkata
700054,
West Bengal,
India
★ Corresponding author: This email address is being protected from spambots. You need JavaScript enabled to view it.
Received:
2
July
2025
Accepted:
14
August
2025
Abstract
Context. Hydrogen recombination lines (HRLs) are valuable diagnostics of the physical conditions in ionized regions surrounding high-mass stars. Understanding these lines, including broadening mechanisms and intensity trends, can provide insights into HII region densities, temperatures, and kinematics.
Aims. This study aims to investigate the physical properties of ionized gas around massive protostars by analysing the HRLs (Hα and Hβ) in the Q band.
Methods. We carried out observations using the Yebes 40m radio telescope in the Q band (30.5–50 GHz) towards six high-mass protostars selected from the SOMA Survey (G45.12+0.13, G45.47+0.05, G28.20−0.05, G35.20−0.74, G19.08−0.29, and G31.28+0.06). The observed line profiles were analysed to assess broadening mechanisms, and electron densities and temperatures were derived. The results were compared with available Q-band data from the TianMa 65-m Radio Telescope (TMRT) that have been reported in the literature, and ALMA Band 1 (35–50 GHz) Science Verification observations towards Orion KL, analysed in this study.
Results. A total of eight Hα (n = 51 to 58) and ten Hβ (n = 64 to 73) lines were detected towards G45.12+0.13, G45.47+0.05, and G28.20−0.05; there were no detections in other sources. We derived electron densities of ~1−5 × 106 cm−3 and temperatures of 8000–10 000 K for the sources. However, for Orion KL, we obtained an electron density one order of magnitude lower, while its temperature was found to be more similar. Interestingly, G45.12 and G28.20 show an increasing intensity trend with frequency for both Hα and Hβ transitions, contrary to the decreasing trend observed in Orion KL.
Conclusions. The line widths of the detected HRLs indicate contributions from both thermal and dynamical broadening, suggesting the presence of high-temperature ionized gas that is likely kinematically broadened (e.g. due to turbulence, outflows, rapid rotation, or stellar winds). Pressure broadening caused by electron density may also have a minor effect. We discuss different scenarios to explain the measured line widths of the HRLs. The contrasting intensity trends between the sources may reflect variations in local physical conditions or radiative transfer effects, highlighting the need for further investigation through higher-resolution observations and detailed modelling.
Key words: astrochemistry / line: identification / line: profiles / methods: data analysis / stars: massive / HII regions
© The Authors 2025
 Open Access article, published by EDP Sciences, under the terms of the Creative Commons Attribution License (https://creativecommons.org/licenses/by/4.0), which permits unrestricted use, distribution, and reproduction in any medium, provided the original work is properly cited.
This article is published in open access under the Subscribe to Open model. This email address is being protected from spambots. You need JavaScript enabled to view it. to support open access publication.
1 Introduction
High-mass protostars and recently formed massive stars may be identified by the presence of small HII regions, known as hyper-compact (HC) or ultra-compact (UC) HII regions if their radii are less than 0.01 and 0.1 parsecs, respectively (e.g. Wood & Churchwell 1989; Kurtz et al. 1994; Gaume et al. 1995; De Pree et al. 2004; Giveon et al. 2005; Keto et al. 2008; Churchwell et al. 2010). These HII regions are expected to be created either by protostellar outflow shock ionization, especially in the earliest protostellar phases (e.g. Gardiner et al. 2024), or by photo-ionization by extreme-ultraviolet radiation emitted from massive stars, including during the later stages of the main protostellar accretion phase (e.g. Tanaka et al. 2016, 2017; see e.g. Tan et al. 2014 for a review). A general evolutionary sequence of HII region expansion is expected as gas density in the vicinity of protostars decreases.
For example, electron densities of a sample of HC HII regions have been found to be ≳105 cm−3, at least an order of magnitude greater than those of UC HII regions with ≳104 cm−3 (Kurtz & Hofner 2005). Radio recombination lines (RRLs) are high principal quantum n spectral lines emitted by electrons recombining with a positive ion. These lines, occurring in the radio frequency portion of the electromagnetic spectrum, are commonly observed in astrophysical environments, including HC and UC HII regions (Churchwell 1990). Radio recombination lines have been widely used in astrophysics, especially as probes of the physical conditions of the plasma (e.g. Alves et al. 2015).
Previous surveys of RRLs have primarily utilized single-dish telescopes operating at centimetre (cm) wavelengths. These cm-RRLs typically exhibit principal quantum numbers of n ≥ 66 and have been observed with angular resolutions normally of about a few arc-minutes. Examples of such surveys include those conducted by Lockman (1989), Caswell & Haynes (1987), Anderson & Bania (2009), Anderson et al. (2014), and Alves et al. (2015). Furthermore, several studies at higher resolutions, using interferometers that focus on individual sources (e.g. Gaume et al. 1995; Sewilo et al. 2004; De Pree et al. 2004; Sewiło et al. 2008; Keto & Klaassen 2008; Zhang et al. 2019a), have provided valuable insights into the characteristics of HC and UC HII regions. For example, these investigations have uncovered significantly broadened line widths within these regions, which tend to diminish as the HII region size increases. Hydrogen recombination lines (HRLs) have also provided key information to constrain the small-scale physical structure in HC HII regions, revealing the presence of ionized discs, winds, and jets towards Cepheus A HW2 and MonR2-IRS2 (Jiménez-Serra et al. 2011, 2013, 2020).
Millimetre and (sub)millimetre HRLs towards HII regions in a large sample of clumps from the APEX Telescope Large Area Survey of the Galaxy (ATLASGAL) have been reported using single-dish telescopes, including the IRAM 30 m, Mopra 22 m, and APEX 12 m (Kim et al. 2017, 2018). Liu et al. (2022) conducted a Q-band survey towards the Orion KL using the Tianma 65 m radio telescope (TMRT) and detected 177 RRLs. Among these, 126 were hydrogen RRLs, 40 were helium RRLs, and 11 were carbon RRLs, with maximum changes in principal quantum number (∆n) of 16, 7, and 3, respectively. Their result suggests hydrogen and helium RRLs arise from M42, while carbon RRLs originate from the photodissociation region (PDR). Following this, Liu et al. (2023) also reported the detection of RRLs of ions heavier than helium using the TMRT telescope’s multi-band (12–50 GHz) line survey of Orion KL.
Here, we present Q-band (30.5–50 GHz) line survey data towards six massive protostars. We report the detection of 18 RRLs towards G45.12+0.13 (hereafter G45.12), G45.47+0.05 (hereafter G45.47), and G28.20−0.05 (hereafter G28.20), and non-detections in three sources, G35.20−0.74 (hereafter G35.20), G19.08−0.29 (hereafter G19.08), and G31.28+0.06 (hereafter G31.28). Line analysis of RRLs provides an estimation of electron densities and temperatures. We discuss the possible mechanisms of line broadening, including thermal, dynamical, and pressure contributions. In addition, we employ a theoretical analysis to constrain the possible electron temperatures and densities of the HII regions associated with the protostars and compare these estimates with the observed results.
This paper is organized as follows. Section 2 describes observational details and data analysis procedures. Results are presented in Sect. 3. A discussion is presented in Sect. 4, and finally, in Sect. 5, we provide concluding remarks.
2 Observations, data reduction, and targets
2.1 Observations and data reduction
The line survey data presented in this paper are part of two Yebes 40 m radio telescope (RT40m) Q-band proposals (Proposal IDs: 21A004 and 23A017; PI: Prasanta Gorai), which cover six high-mass protostars that are part of the SOFIA Massive (SOMA) star formation survey (PI: J. Tan; De Buizer et al. 2017; Liu et al. 2019, 2020; Fedriani et al. 2023; Telkamp et al. 2025). The co-ordinates of our targets (G28.20, G45.47, G45.12, G35.20, G19.08, and G31.28), along with their line of sight velocities (υLSR) and distances, are summarized in Table 1.
For the source G28.20, observations were carried out using the Yebes 40 m single-dish radio telescope from 25 to 27 October 2021 with a total observing time of 15 hours. The other five sources were observed from 30 March to 18 April 2023, with a total observation time of 40 hours. The survey was carried out using new receivers built within the Nanocosmos project (Tercero et al. 2021), which consisted of two cooled high electron mobility transistor amplifiers covering the 31.52–49.97 GHz band with dual polarizations. Fast Fourier transform spectrometers (FFTSs) with a 8×2.5 GHz bandwidth and a spectral resolution of 38.15 kHz provide full coverage of the Q band in both polarizations. These observations were performed using the standard position-switching mode. The beam size varies from ~54″ at 32 GHz to 36″ at 48 GHz. The calibration was performed at the beginning of the position-switching, observing the sky and both hot and cold loads, and repeating this procedure every 18 min. Pointing and focus were corrected hourly through pseudo-continuum observations of intense SiO maser lines towards evolved stars close to our target sources. The pointing errors were within 7″, and the calibration uncertainties are estimated to be less than 15%.
The off-source positions were regions where the visual extinction (AV) is below three mag in the AV maps obtained from the Atras and Catalogue of Dark Clouds (Dobashi et al. 2005)1. For our analysis, we converted the observed antenna temperature (TA) to the main beam brightness temperature (Tmb) using the main beam efficiency, Beff = 0.738 exp(-(ν(GHz)/72.2)2), and forward efficiency, Feff = 0.97 (Tercero et al. 2021), using the formula Tmb = TA × (Feff/Beff). We used the CLASS software from the GILDAS2 package to create FITS files by reducing and combining data from the different dates of observations. We conducted line analyses in the CASSIS software (Vastel et al. 2015). We have detected 18 recombination lines towards three sources: G28.20, G45.12, and G45.47. In contrast, there is no RRL identification towards the other three sources: G35.20, G19.08, and G31.28. Hence, in the remainder of the paper, we focus solely on the targets for which we have detected HRLs.
Summary of target sources.
2.2 Targets
The sources were selected from the SOFIA Massive (SOMA) star formation survey (De Buizer et al. 2017; Liu et al. 2019, 2020; Fedriani et al. 2023; Telkamp et al. 2025), which used SOFIA-FORCAST to measure 8–40 µm emission of a sample of ≳50 sources. The SOMA sources have well-measured IR spectral energy distributions (SEDs), allowing for detailed constraints on the physical properties of the sources. Our six target sources belong to three different groups in the SOMA sample: Type I, ‘MIR sources in IRDCs’ – relatively isolated sources in infrared dark clouds; Type II, ‘Hypercompact’ – often jet-like, radio sources, for which the MIR emission extends beyond the observed radio emission; and Type III, ‘Ultra-compact’ – radio sources for which the radio emission is more extended than the MIR emission. The luminosity of all these sources is within the range of 104−105 L⊙. In our sample, we have two sources of each type. The source co-ordinates (RA, Dec), distance, systematic velocity (υLSR), and bolometric luminosity are provided in Table 1. In the following sections, brief descriptions of G45.12, G45.47, and G28.20 sources are provided.
2.2.1 G45.12+00.13
G45.12+00.13 (IRAS 19111+1048) has a measured far kinematic distance of 7.4 kpc (Ginsburg et al. 2011). The radio morphology of this region shows a highly inhomogeneous ionized medium (Vig et al. 2006), which is consistent with the extended mid-infrared (MIR) morphology (Liu et al. 2019). Vig et al. (2006) proposed that the source is an embedded cluster of zero-age main sequence (ZAMS) stars with 20 compact sources, including one non-thermal source, identified by their radio emission. The central UCHII source S14 is deduced to be of spectral type O6 from the integrated radio emission. However, recent results from Sequeira-Murillo et al. (2025), as part of the SOMA Radio survey, only detected the very compact point source S20 (i.e. the non-thermal source) and the innermost part of the UC HII region source S14. They concluded that most of the emission to the north-west of the central UC HII region arises from an extended and diffuse irregular cloud of ionized material, rather than a cluster of compact sources. Based on SOFIA images, Liu et al. (2019) found MIR to far-infrared emission peaking at the S14 position. They did not find a distinct source at the position of G45.12+0.13 west, and concluded that the MIR extension to the south-west of S14 could be due to blueshifted outflows, which are also revealed in the near-infrared. Previously, several HRLs, such as H30α, H76α, H99α, and H110α, were reported in this source (Wood & Churchwell 1989; Araya et al. 2002; Churchwell et al. 2010; Tan et al. 2020).
2.2.2 G45.47+00.05
G45.47+0.05 was first detected as a UC HII region in the radio continuum at 6 cm (Wood & Churchwell 1989) and lies at a distance of 8.4 kpc. A bipolar wide-angle ionized outflow was discovered from the massive protostar G45.47+0.05 using VLA and ALMA observations (Rosero et al. 2019; Zhang et al. 2019b). The H30α recombination line showed strong maser amplification. It also suggested that there is a photoevaporation flow launched from a disc of radius 110 au, with an electron temperature (Te) of 104 K and an electron number density (ne) of 1.5 × 107 cm−3 (Zhang et al. 2019b). High-angular-resolution (0.4″) VLA data revealed that G45.47 is resolved into 2 cm continuum sources separated by 0.4″ (Rosero et al. 2019). Zhang et al. (2019a) also reported the presence of an ionized jet candidate seen towards the south of the central, brightest component, possibly of a non-thermal nature.
2.2.3 G28.20−0.05
G28.20−0.05 is an isolated massive protostar associated with a HC HII region, located at a distance of 5.7 kpc (Sewiło et al. 2008). There is compelling evidence that ionizing feed-back occurs within its protostellar core. This feedback manifests through the ionization of its disc wind and, notably, some surrounding denser gas structures. This is corroborated by a ring emitting centimetre to millimetre free-free radiation (Sewiło et al. 2008, 2011; Law et al. 2022). This source shows chemically rich properties along with recombination lines (Gorai et al. 2024; Law et al. 2025).
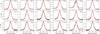 |
Fig. 1 The observed and Gaussian fitted spectra of Hα and Hβ lines towards G45.12+0.13. The black line represents observed spectra and the red line depicts the Gaussian fitted spectra. |
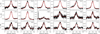 |
Fig. 2 The observed and Gaussian fitted spectra of Hα and Hβ lines towards G45.47+0.05. The black line represents observed spectra and the red line depicts the Gaussian fitted spectra. |
3 Results
3.1 identification of RRLs and observed line parameters
The rest frequency of RRLs can be expressed as
 (1)
(1)
where
 (2)
(2)
Here, c is the speed of light, R∞ is the Rydberg constant (R∞ = 109737.31568 cm−1), me is the mass of the electron, and mn is the mass of the corresponding neutral atom. We have six sources in our sample (see Table 1). We have detected 8 Hα transitions and 10 Hβ transitions towards three sources. None of these transitions are detected towards G35.20, G19.08, and G31.28, and we shall not discuss these sources in the following sections. Figures 1, 2, and 3 depict the observed recombination lines towards G45.12, G45.47, and G28.20, respectively. Table 2 summarizes all the detected transitions.
3.2 Properties of millimetre hydrogen recombination lines
Figures 1, 2, and 3 show the observed and Gaussian fitted spectra towards G45.12, G45.47, and G28.20, respectively. The line width (FWHM, ∆υ) and peak intensity (Tmb) of each observed HRL are measured by fitting a single Gaussian to the observed spectrum. However, the fitting result obtained for the H55α line may not be accurate due to the discontinuity feature in the observed profile. The discontinuity in the observed profile is due to the emission being detected in two different sections of the FFTS. The line parameters of all the observed transitions, such as the rest frequency (ν0), full width at half maximum (FWHM), intensity, and integrated intensity, are summarized in Table 2. We find that the line width is around 40 km s−1 for G45.12, ~ 30–40 km s−1 for G45.47, and ~30–35 km s−1 for G28.20 (see Table 2). If we consider a temperature of Te = 104 K, the thermal line width of hydrogen is 21.4 km s−1. Hence, thermal broadening alone cannot explain the observed line width, which requires non-thermal motion of the gas to contribute to the broadening.
Table 3 shows the linewidth ratios of detected Hnα (i.e. n = 51, 55, 53, 54, 55, 57, 58) to the H56α and Hnβ (n = 64, 65, 66, 67, 68, 69, 79, 70 72, 73) to the H71β The ratios are close to unity for all transitions, which indicates that different transitions are probing the same gas under the same physical conditions. Some relative differences may be due to microturbulence and different gas kinematics, such as rotation and outflow. The line width of the recombination lines is discussed in more detail in Sect. 3.3.
Figure 4 shows the observed intensity variation with frequency for the Hα and Hβ lines. We apply a power-law fit to the observed trend of HRL intensity with frequency. For G45.12 and G28.20, both Hα and Hβ lines exhibit positive spectral indices (slopes close to or above 1), suggesting a nearly linear or mildly increasing trend of intensity with frequency. In G45.47, the Hα line shows an almost flat dependence (slope ~ 0), while H/β has a slightly rising trend, indicating a weaker frequency dependence. Furthermore, we compared our results with single-dish observations of Orion KL (Liu et al. 2022). In contrast to our target sources, Orion KL shows steep negative slopes for both Hα (−4.01) and H/β (−2.23), indicating that the line intensities decrease sharply with frequency.
Comparing peak intensity ratios of mm-RRLs is useful for diagnosing whether they are emitted under local thermodynamic equilibrium (LTE) or non-LTE conditions. The LTE line ratio between different transitions can be estimated as follows (Dupree & Goldberg 1970):
 (3)
(3)
where f is the oscillator strength, n is the lower level of a nα line, and m is the lower level of a higher-order line (here Hβ) at nearly the same frequency. The oscillator strength values have been taken from Menzel (1968). The observed line ratio and LTE ratio are provided in Table 4. The peak-intensity ratios of both Hα and Hβ lines are, on average, consistent with the corresponding LTE ratios. Furthermore, we included the results of Orion KL in the same table and found that the estimated ratios slightly deviate from the LTE value.
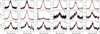 |
Fig. 3 The observed and Gaussian fitted spectra of Hα and Hβ lines towards G28.20−0.05. The black line represents observed spectra and the red line depicts the Gaussian fitted spectra. |
Summary of Gaussian fit of detected recombination lines towards three high-mass sources.
3.3 Line width of recombination lines
As was described in Galván-Madrid et al. (2012), several mechanisms may cause the broadening of RRL line widths. These include: (a) thermal/microturbulence Gaussian broadening, caused by the motion of emitting particles and gas parcels on small scales; (b) pressure (Stark) broadening due to the perturbation of atomic energy levels by the electric field from nearby charged particles; and (c) dynamical broadening arising from bulk gas flows, such as infall, rotation, and outflow. A comprehensive discussion of these processes and the underlying physics of RLs is given by Gordon & Sorochenko (2002).
The natural broadening due to quantum uncertainty, ∆E, of the energy level is negligible for radio and (sub)mm RLs. The thermal distributions of velocities of both small pockets and individual particles of gas (i.e. ‘microturbulence’) produce a Gaussian contribution to the broadening. Neglecting microturbulence, the thermal line width is
 (4)
(4)
where kB is the Boltzmann constant and mH is the mass of the hydrogen atom. Here, all the gas is assumed to be thermalized to the electron temperature, Te. The prescription of thermal line width is independent of electron density and proportional to the square root of the temperature. Thermal line widths (dashed orange lines) for different Hα and Hβ transitions with varying electron temperatures are shown in Fig. 5 (also see Fig. 6 for Hβ transitions). The figure shows the thermal line widths for three sets of electron temperatures and electron densities. For instance, assuming Te = 7000 K, we obtain ∆υth = 18.54 km s−1.
Pressure broadening shows a Lorentzian shape, increasing with density and quantum number. Collisions with ions and electrons contribute differently to the broadening, with the ion contribution taking the form following Galván-Madrid et al. (2012)
 (5)
(5)
where γi = 6−2.7 × 10⁻⁵Te − 0.13(n + 1)/100. For Te = 9000 K and Nį = 107 cm−3, the H30α line is virtually free from ion broadening (0.04 km s−1 , and decreases close to linearly with decreasing Te), whereas the H53α line is broadened by 5.1 km s−1 . Under most conditions, collisions with electrons dominate over those with ions, resulting in a broadening with a width given by Galván-Madrid et al. (2012)
 (6)
(6)
For ne = 107 cm−3 , the electron broadening for the H53α and H30α are ≈37.3 km s−1 and 0.6 km s−1, respectively. Figure 5 shows the pressure broadening effect for different electron temperatures and densities. It shows the increasing trend of line width with both electron density and quantum number of the transitions.
The final source of broadening is due to bulk motions of the ionized gas (∆υdyn), which may arise from outflows or winds, infall or accretion, and rotational dynamics. Hence, the total RL width (∆υ) has contributions from thermal broadening (∆υth), dynamical broadening from macroscopic gas motions (∆υdyn), and pressure broadening (∆υpr). The FWHM of the combined line profile is given by Galván-Madrid et al. (2009)
 (7)
(7)
The variation in thermal and pressure broadening with different electron temperatures and densities is shown in Figs. 5 and 6. These figures compare the measured line widths and theoretical estimates of broadening for Hα and Hβ lines. From these comparisons, we can examine the impact of various choices of electron temperature and density. The top and bottom panels of either figure show that with low (~1 × 105 cm−3) or high (~1 × 107 cm−3) electron density, the theoretical prediction, such as the combined thermal and pressure broadening effect, cannot explain the observed line widths for sources G45.12, G45.47, and G28.20, even with higher electron temperatures (10 000 K). For the low-electron-density case, it is underpredicted, and for the high-electron-density one, it is overpredicted. However, we find reasonably good matches between the theoretical estimation and observations at intermediate electron densities (~1−5 × 106 cm−3) and electron temperatures of around 8000–10000 K. On the other hand, it is clear from Figs. 5 and 6 that the pressure broadening shows an increasing trend of line width with quantum number n and electron density, whereas our observed line width for different recombination lines is more or less similar, which indicates that dynamical broadening would be important in this scenario. We did not include the dynamical broadening in the comparison because we do not know the microscopic motion of the gas. Nevertheless, we note that the level of dynamical broadening is degenerate with contributions from thermal broadening. Thus, low-temperature and low-density models could yield acceptable fits to the data when a dynamical broadening component is included (see Sect. 4). High-resolution data of the HRLs are needed to search for potential spatially resolved velocity gradients that may yield more direct constraints on the level of dynamical broadening.
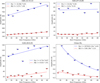 |
Fig. 4 Comparison of the observed intensity of Hα and Hβ towards our target sources and Orion KL. |
Ratios of Hnα line width to H56α and ratios of Hnβ line width to H71β.
Comparison of LTE-predicted and observed line intensity ratios.
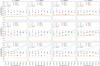 |
Fig. 5 Comparison between observed and theoretical line widths of Hα lines for different electron densities and temperatures. In each panel, the dotted blue line represents the contribution from pressure broadening, the dashed orange line represents thermal broadening, and the dash-dotted green line depicts the combined contribution from thermal and pressure broadening. Line width data of Orion KL is taken from (Liu et al. 2022). |
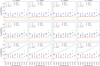 |
Fig. 6 Comparison between observed and theoretical line widths of Hβ lines for different electron density and temperature. The dotted blue line represents the contribution from pressure broadening, the dashed orange line represents the thermal broadening, and the dash-dotted green line depicts the combined contribution from thermal and pressure broadening. Line width data of Orion KL are taken from (Liu et al. 2022). |
3.4 Electron temperature and density
Since our observations are single-pointing, single-dish measurements, we do not have accompanying continuum data. As a result, it is challenging to determine the electron temperature directly from line-to-continuum ratios. Therefore, we primarily relied on an empirical prescription based on the galactocentric distance to estimate the electron temperature for the different sources. Due to the gradient of metallicity with Galactocentric distance (dG), the electron temperature in HII regions is known to vary. This variation has been parameterized as (Zhang et al. 2023):
 (8)
(8)
The Galactocentric distances of each source are provided in Table 1. For G28.20 (DG = 4.10 kpc), the obtained electron temperature (Te) is 6825 ± 589 K. Similarly, electron temperatures are estimated at 7054 ± 681 K and 7050 ± 679 K for G45.47 (DG = 5.80 kpc) and G45.12 (DG = 5.77 kpc), respectively.
The electron density may be estimated following the equation given by Keto et al. (2008):
 (9)
(9)
where ∆νL is the Lorentzian width and ∆νth is the thermal width, and ∆n = 1 for Hα transitions and ∆n = 2 for Hβ transitions. Using the above prescription, we measured the electron density of all transitions, which is summarized in Table 5. The measured electron densities for all sources are ~106 cm−3.
Calculated electron densities (ne) for different transitions across all sources.
Thermal and dynamical broadening of HRLs.
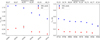 |
Fig. 7 Line intensities of the Hα and Hβ recombination lines based on ALMA data, measured towards the RRL peak and the hot core region of Orion KL. |
4 Discussion
The measured line widths of the Hα and Hβ transitions towards G28.20, G45.45, and G45.12 are ~35–40 km s−1 (see Table 2). However, the measured line widths of these transitions in Orion KL are around ~25 km/s (Liu et al. 2022). These differences could be due to several factors. The electron temperature determines thermal broadening, which contributes to the overall line width of the spectrum. The estimated electron temperature in Orion KL is 7391 ± 840 K, considering a Galactocentric distance of 8.3 kpc (Milam et al. 2005). For our target sources, we obtained similar temperatures (see Sect. 3.4). However, we observe apparent differences in line width between Orion KL and other sources, despite their similar electron temperatures. Therefore, thermal broadening alone cannot explain these differences. These variations suggest different pressure-broadening effects caused by distinct electron density levels in the sources or different levels of dynamical broadening. Figures 5 and 6 show a comparison between observed and theoretically measured line widths for Hα and Hβ transitions, respectively. These figures compare the theoretical and observed line widths for varying electron densities and temperatures. Thermal broadening is independent of the quantum number of RRLs and is proportional to the magnitude of the temperature for the same species. In contrast, for a low electron density (e.g. ~5 × 105 cm−3), pressure broadening has a minimal effect on the line width, whereas for a high electron density (e.g. ~l × 107 cm−3), it has a significant impact. The pressure broadening highly depends on the electron density and increases with the quantum numbers of the transition. We find good agreement between the observed and theoretical line widths for the Hα and Hβ lines in G45.12, G45.47, and G28.20 with a high electron temperature of ~ 8000–10000 K and a moderate electron density of ~l−5× 106 cm−3.
On the other hand, our comparison (see Figs. 5 and 6) clearly shows a dependence on the quantum number of pressure broadening, which was not evident from the measured line widths, as they mostly show similar values for all HRLs (see Table 2). In this scenario, dynamical broadening would then play the crucial role. The photoionized disc-wind outflows around forming massive stars are important for understanding the line profile broadening of recombination lines (Tanaka et al. 2016; Martínez-Henares et al. 2023, 2024).
Furthermore, we compare our results with those of Orion KL. Here, the line widths of RRLs measured show only a minor effect from pressure broadening, since Orion KL has an electron density at least one order of magnitude lower than the sources reported in this study. The best-fit electron density and temperature for Orion KL are 1−5 × 105 cm−3 and 8000–10000 K, respectively. The best fitted electron density is consistent with the inferred electron density (~l × 106 cm−3) obtained with the given prescription in Sect. 3.4 (also see Table 5). Since we did not observe an increasing trend in the line widths of the detected HRLs, we assume that the widths are less affected by pressure broadening, probably indicating a low electron density (~105 cm−3). Hence, the measured line width is most likely due to the thermal and dynamical broadening. Therefore, we estimated the dynamical broadening for all sources by subtracting the thermal width from the measured line width. All values are summarized in Table 6.
Figure 4 shows the intensity variation with frequency (recombination lines transitions in descending order of quantum numbers) for our target sources along with the existing result of Orion KL (Liu et al. 2022). We found an increasing trend in line intensity with frequency for both Hα and Hβ lines in G45.12 and G28.20, with a slope of 1. For G45.47, the trend is relatively flat. The increasing intensity trend of the RRLs may result from ionized wind, partially optically thick emission, density, and temperature gradients, or beam dilution effects. Weak non-LTE effects (e.g. stimulated emission) can enhance the line intensity at higher frequencies, particularly in dense and dynamic HII regions. The rising intensity likely reflects the compact and dense nature of these YSOs’ HII regions, with higher frequencies tracing regions of elevated ne or Te. Additionally, the increasing trend may partly result from improved resolution at higher frequencies (e.g. around 50 GHz), where the synthesized beam is slightly better compared to the source size. The beam of the Yebes 40m telescope varies significantly across the Q band, ranging from 55″ at the lowest frequencies to 35″ at the highest. If the source is compact relative to the beam size, this variation can substantially affect the observed intensity of the HRLs.
In contrast, the Orion KL exhibits the opposite trend compared to our target sources, where the intensity of HRLs decreases with frequency in the 30–50 GHz range. This behaviour suggests either optical depth effects or beam dilution, as it varies with frequency. In single-dish observations of Orion KL, the primary beam size was 30″ at 40 GHz (Liu et al. 2022). To further investigate, we examined the trend in HRL intensities in Orion KL using ALMA Band 1 line survey data (see Fig. 7) and found a similar result to that obtained from single-dish observations. For this analysis, we selected two different locations (see Fig. 8): one near the hot core peak and another near the RRL peak, where HRLs are particularly strong. We measured the line intensities from spectra extracted within a 30″-diameter aperture. The opposite trend in the Orion KL can be attributed to specific local conditions and physical processes affecting the source. The local electron density and temperature can affect the population of energy levels differently. Interestingly, while lower-order transitions like H51α are expected to be more intense than higher-order ones (e.g. H56α) under low-density conditions due to collisional excitation, we observe the opposite trend. The observed reversal trend suggests that non-LTE effects, higher electron densities, or optical depth effects may be influencing the excitation and radiative transfer of the HRLs in this region. The decreasing intensity trend with frequency may be due to a more extended, lower-density, or more evolved HII region. The narrower line widths of RRLs towards Orion KL compared to our target sources suggest less dynamical activity. This region may be older or less massive, with a lower-density HII region, which explains both the lower intensity and narrower lines. Dust absorption could also contribute to the reduced intensity, especially if a dense dust envelope surrounds the source. Additionally, the decreasing trend might be influenced by stimulated emission in higher-n RRLs (i.e. those at lower frequencies), as these effects are more pronounced in transitions with high principal quantum numbers and lower-density environments. Nonetheless, high-spatial-resolution observations and modelling are necessary to understand the specific reasons for this behaviour, and such studies can provide valuable insights into the diverse nature of ionized regions.
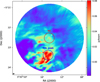 |
Fig. 8 7.1 mm continuum image of Orion KL. Blue and red circles indicate the 30″ diameter regions centred on the hot core and the RRL peak, from which spectra were extracted to measure the line intensity, as is shown in Fig. 7. |
5 Conclusions
We have conducted a comprehensive spectral line survey targeting six high-mass protostars, employing the Q-band receiver of the Yebes 40m telescope. This survey spanned a frequency range of 31.5–50 GHz and marks the first Q-band line survey conducted towards three high-mass sources: G45.12, G28.20, and G45.47. The key findings from this study are outlined below:
We detected 18 recombination lines using the RT40m Q-band observations towards three high-mass protostars. Among these lines, eight correspond to Hα (n = 51 to 58) transitions, and the remaining ten are Hβ (n = 64 to 73) transitions. We determined the line parameters, including the line width, peak line intensity, and integrated intensity;
We obtained an electron density of approximately 1−5 × 106 cm−3 and a temperature of around 8000–10 000 K for G45.12, G28.20, and G45.47. In contrast, the electron density for Orion KL is about an order of magnitude lower, at ~1−5 × 105 cm−3, while the temperature remains in a similar range of ~8000–10 000 K. However, we did not find the line trend that broadens with the quantum number, as is shown in Figs. 5 and 6, which is prominent for the high electron density of ≥~105 cm−3. Therefore, pressure broadening might have a minor effect compared to thermal and dynamical broadening. Hence, our constrained electron density can be considered as an upper limit;
The observed line widths cannot be accounted for by thermal broadening alone. We consider dynamical broadening to play a significant role in explaining the width of the HRLs, suggesting the presence of turbulence, rotation, or outflow-broadened line widths of ionized gas. The potential contribution of dynamical broadening for all sources has been estimated by subtracting the thermal line width from the measured line widths;
The intensity profiles of the Hα and Hβ transitions show an increasing trend with frequency for G45.12 and G28.20, with a slope of ~ 1 obtained from a power-law fit. For G45.47 it is almost flat. In contrast, Orion KL exhibits a decreasing intensity trend with increasing frequency. This could be due to several reasons, such as differences in physical structures (e.g. electron density), optically thin or thin lines, stimulated emission, maser effects, and beam dilutions. Further investigation is required with the systematic high-spatial-resolution data.
Acknowledgements
Based on observations carried out with the Yebes 40m telescope (projects 21A-004 and 23A017). The 40 m radiotelescope at Yebes Observatory is operated by the Spanish Geographic Institute (IGN, Ministerio de Transportes, Movilidad y Agenda Urbana). This paper makes use of the following ALMA data: ADS/JAO.ALMA#2011.0.00022.SV. ALMA is a partnership of ESO (representing its member states), NSF (USA) and NINS (Japan), together with NRC (Canada), NSTC and ASIAA (Taiwan), and KASI (Republic of Korea), in cooperation with the Republic of Chile. The Joint ALMA Observatory is operated by ESO, AUI/NRAO and NAOJ. P.G. and M.S. acknowledge the ESGC project (project No. 335497) funded by the Research Council of Norway. K.T. is supported by JSPS KAKENHI grant Nos. 21H01142, 24K17096, and 24H00252. M.G.-G. acknowledges support from the grant PID2023-146056NB-C21 (CRISPNESS) funded by MICIU/AEI/10.13039/501100011033 and by ERDF/EU. I.J.-S. acknowledges funding from grant PID2022-136814NB-I00 funded by the Spanish Ministry of Science, Innovation and Universities/State Agency of Research MICIU/AEI/ 10.13039/501100011033 and by “ERDF/EU”. R.F. acknowledges financial support from the Severo Ochoa grant CEX2021-001131-S MICIU/AEI/ 10.13039/501100011033 and PID2023-146295NB-I00. C-Y.L. acknowledges the financial support through the INAF Large Grant The role of MAGnetic fields in MAssive star formation (MAGMA). G.B. acknowledges support from the PID2020-117710GB-I00 grant funded by MCIN/AEI/10.13039/501100011033 and from the PID2023-146675NB-I00 (MCI-AEI-FEDER, UE) program. BALG is supported by the German Research Foundation (DFG) in the form of an Emmy Noether Research Group – DFG project #542802847 (GA 3170/3-1).
References
- Alves, M. I. R., Calabretta, M., Davies, R. D., et al. 2015, MNRAS, 450, 2025 [NASA ADS] [CrossRef] [Google Scholar]
- Anderson, L. D., & Bania, T. M. 2009, ApJ, 690, 706 [NASA ADS] [CrossRef] [Google Scholar]
- Anderson, L. D., Bania, T. M., Balser, D. S., et al. 2014, ApJS, 212, 1 [Google Scholar]
- Araya, E., Hofner, P., Churchwell, E., & Kurtz, S. 2002, ApJS, 138, 63 [NASA ADS] [CrossRef] [Google Scholar]
- Beltrán, M. T., Cesaroni, R., Moscadelli, L., et al. 2016, A&A, 593, A49 [NASA ADS] [CrossRef] [EDP Sciences] [Google Scholar]
- Caswell, J. L., & Haynes, R. F. 1987, A&A, 171, 261 [NASA ADS] [Google Scholar]
- Churchwell, E. 1990, A&A Rev., 2, 79 [Google Scholar]
- Churchwell, E., Sievers, A., & Thum, C. 2010, A&A, 513, A9 [NASA ADS] [CrossRef] [EDP Sciences] [Google Scholar]
- Codella, C., Cesaroni, R., López-Sepulcre, A., et al. 2010, A&A, 510, A86 [NASA ADS] [CrossRef] [EDP Sciences] [Google Scholar]
- De Buizer, J. M., Liu, M., Tan, J. C., et al. 2017, ApJ, 843, 33 [Google Scholar]
- De Pree, C. G., Wilner, D. J., Mercer, A. J., et al. 2004, ApJ, 600, 286 [NASA ADS] [CrossRef] [Google Scholar]
- Dobashi, K., Uehara, H., Kandori, R., et al. 2005, PASJ, 57, S1 [Google Scholar]
- Dupree, A. K., & Goldberg, L. 1970, ARA&A, 8, 231 [Google Scholar]
- Fedriani, R., Tan, J. C., Telkamp, Z., et al. 2023, ApJ, 942, 7 [NASA ADS] [CrossRef] [Google Scholar]
- Galván-Madrid, R., Keto, E., Zhang, Q., et al. 2009, ApJ, 706, 1036 [CrossRef] [Google Scholar]
- Galván-Madrid, R., Goddi, C., & Rodríguez, L. F. 2012, A&A, 547, L3 [NASA ADS] [CrossRef] [EDP Sciences] [Google Scholar]
- Gardiner, E. C., Tan, J. C., Staff, J. E., et al. 2024, ApJ, 967, 145 [Google Scholar]
- Gaume, R. A., Claussen, M. J., de Pree, C. G., Goss, W. M., & Mehringer, D. M. 1995, ApJ, 449, 663 [Google Scholar]
- Ginsburg, A., Darling, J., Battersby, C., Zeiger, B., & Bally, J. 2011, ApJ, 736, 149 [NASA ADS] [CrossRef] [Google Scholar]
- Giveon, U., Becker, R. H., Helfand, D. J., & White, R. L. 2005, AJ, 130, 156 [Google Scholar]
- Gorai, P., Law, C.-Y., Tan, J. C., et al. 2024, ApJ, 960, 127 [NASA ADS] [CrossRef] [Google Scholar]
- Gordon, M. A., & Sorochenko, R. L. 2002, Radio Recombination Lines. Their Physics and Astronomical Applications (Kluwer Academic Publishers), 282 [Google Scholar]
- Hofner, P., Peterson, S., & Cesaroni, R. 1999, ApJ, 514, 899 [Google Scholar]
- Jiménez-Serra, I., Martín-Pintado, J., Báez-Rubio, A., Patel, N., & Thum, C. 2011, ApJ, 732, L27 [CrossRef] [Google Scholar]
- Jiménez-Serra, I., Báez-Rubio, A., Rivilla, V. M., et al. 2013, ApJ, 764, L4 [Google Scholar]
- Jiménez-Serra, I., Báez-Rubio, A., Martín-Pintado, J., Zhang, Q., & Rivilla, V. M. 2020, ApJ, 897, L33 [Google Scholar]
- Keto, E., & Klaassen, P. 2008, ApJ, 678, L109 [NASA ADS] [Google Scholar]
- Keto, E., Zhang, Q., & Kurtz, S. 2008, ApJ, 672, 423 [NASA ADS] [CrossRef] [Google Scholar]
- Kim, W. J., Wyrowski, F., Urquhart, J. S., Menten, K. M., & Csengeri, T. 2017, A&A, 602, A37 [NASA ADS] [CrossRef] [EDP Sciences] [Google Scholar]
- Kim, W. J., Urquhart, J. S., Wyrowski, F., Menten, K. M., & Csengeri, T. 2018, A&A, 616, A107 [CrossRef] [EDP Sciences] [Google Scholar]
- Kurtz, S., & Hofner, P. 2005, AJ, 130, 711 [NASA ADS] [Google Scholar]
- Kurtz, S., Churchwell, E., & Wood, D. O. S. 1994, ApJS, 91, 659 [Google Scholar]
- Law, C.-Y., Tan, J. C., Gorai, P., et al. 2022, ApJ, 939, 120 [NASA ADS] [CrossRef] [Google Scholar]
- Law, C. J., Zhang, Q., Frommer, A. C., et al. 2025, ApJS, 276, 54 [Google Scholar]
- Liu, M., Tan, J. C., De Buizer, J. M., et al. 2019, ApJ, 874, 16 [NASA ADS] [CrossRef] [Google Scholar]
- Liu, M., Tan, J. C., De Buizer, J. M., et al. 2020, ApJ, 904, 75 [NASA ADS] [CrossRef] [Google Scholar]
- Liu, X., Liu, T., Shen, Z., et al. 2022, ApJS, 263, 13 [NASA ADS] [CrossRef] [Google Scholar]
- Liu, X., Liu, T., Shen, Z., et al. 2023, A&A, 671, L1 [NASA ADS] [CrossRef] [EDP Sciences] [Google Scholar]
- Lockman, F. J. 1989, ApJS, 71, 469 [Google Scholar]
- Martínez-Henares, A., Jiménez-Serra, I., Martín-Pintado, J., et al. 2023, ApJ, 955, 119 [CrossRef] [Google Scholar]
- Martínez-Henares, A., Zhang, Q., Jiménez-Serra, I., et al. 2024, ApJ, 971, L7 [Google Scholar]
- Menzel, D. H. 1968, Nature, 218, 756 [CrossRef] [Google Scholar]
- Milam, S. N., Savage, C., Brewster, M. A., Ziurys, L. M., & Wyckoff, S. 2005, ApJ, 634, 1126 [Google Scholar]
- Minier, V., Burton, M. G., Hill, T., et al. 2005, A&A, 429, 945 [NASA ADS] [CrossRef] [EDP Sciences] [Google Scholar]
- Rosero, V., Tanaka, K. E. I., Tan, J. C., et al. 2019, ApJ, 873, 20 [Google Scholar]
- Sequeira-Murillo, F., Rosero, V., Marvil, J., et al. 2025, arXiv e-prints [arXiv:2507.16775] [Google Scholar]
- Sewilo, M., Churchwell, E., Kurtz, S., Goss, W. M., & Hofner, P. 2004, ApJ, 605, 285 [Google Scholar]
- Sewilo, M., Churchwell, E., Kurtz, S., Goss, W. M., & Hofner, P. 2008, ApJ, 681, 350 [Google Scholar]
- Sewilo, M., Churchwell, E., Kurtz, S., Goss, W. M., & Hofner, P. 2011, ApJS, 194, 44 [CrossRef] [Google Scholar]
- Tan, J. C., Beltrán, M. T., Caselli, P., et al. 2014, in Protostars and Planets VI, eds. H. Beuther, R. S. Klessen, C. P. Dullemond, & T. Henning, 149 [Google Scholar]
- Tan, W. S., Araya, E. D., Lee, L. E., et al. 2020, MNRAS, 497, 1348 [NASA ADS] [CrossRef] [Google Scholar]
- Tanaka, K. E. I., Tan, J. C., & Zhang, Y. 2016, ApJ, 818, 52 [CrossRef] [Google Scholar]
- Tanaka, K. E. I., Tan, J. C., Staff, J. E., & Zhang, Y. 2017, ApJ, 849, 133 [Google Scholar]
- Telkamp, Z., Fedriani, R., Tan, J. C., et al. 2025, ApJ, 986, 15 [Google Scholar]
- Tercero, F., López-Pérez, J. A., Gallego, J. D., et al. 2021, A&A, 645, A37 [EDP Sciences] [Google Scholar]
- Vastel, C., Bottinelli, S., Caux, E., Glorian, J. M., & Boiziot, M. 2015, in SF2A-2015: Proceedings of the Annual meeting of the French Society of Astronomy and Astrophysics, 313 [Google Scholar]
- Vig, S., Ghosh, S. K., Kulkarni, V. K., Ojha, D. K., & Verma, R. P. 2006, ApJ, 637, 400 [Google Scholar]
- Wood, D. O. S., & Churchwell, E. 1989, ApJS, 69, 831 [Google Scholar]
- Zhang, Y., Tan, J. C., Sakai, N., et al. 2019a, ApJ, 873, 73 [NASA ADS] [CrossRef] [Google Scholar]
- Zhang, Y., Tanaka, K. E. I., Rosero, V., et al. 2019b, ApJ, 886, L4 [NASA ADS] [CrossRef] [Google Scholar]
- Zhang, C., Zhu, F.-Y., Liu, T., et al. 2023, MNRAS, 520, 3245 [NASA ADS] [CrossRef] [Google Scholar]
All Tables
Summary of Gaussian fit of detected recombination lines towards three high-mass sources.
All Figures
|
Fig. 1 The observed and Gaussian fitted spectra of Hα and Hβ lines towards G45.12+0.13. The black line represents observed spectra and the red line depicts the Gaussian fitted spectra. |
| In the text | |
|
Fig. 2 The observed and Gaussian fitted spectra of Hα and Hβ lines towards G45.47+0.05. The black line represents observed spectra and the red line depicts the Gaussian fitted spectra. |
| In the text | |
|
Fig. 3 The observed and Gaussian fitted spectra of Hα and Hβ lines towards G28.20−0.05. The black line represents observed spectra and the red line depicts the Gaussian fitted spectra. |
| In the text | |
|
Fig. 4 Comparison of the observed intensity of Hα and Hβ towards our target sources and Orion KL. |
| In the text | |
|
Fig. 5 Comparison between observed and theoretical line widths of Hα lines for different electron densities and temperatures. In each panel, the dotted blue line represents the contribution from pressure broadening, the dashed orange line represents thermal broadening, and the dash-dotted green line depicts the combined contribution from thermal and pressure broadening. Line width data of Orion KL is taken from (Liu et al. 2022). |
| In the text | |
|
Fig. 6 Comparison between observed and theoretical line widths of Hβ lines for different electron density and temperature. The dotted blue line represents the contribution from pressure broadening, the dashed orange line represents the thermal broadening, and the dash-dotted green line depicts the combined contribution from thermal and pressure broadening. Line width data of Orion KL are taken from (Liu et al. 2022). |
| In the text | |
|
Fig. 7 Line intensities of the Hα and Hβ recombination lines based on ALMA data, measured towards the RRL peak and the hot core region of Orion KL. |
| In the text | |
|
Fig. 8 7.1 mm continuum image of Orion KL. Blue and red circles indicate the 30″ diameter regions centred on the hot core and the RRL peak, from which spectra were extracted to measure the line intensity, as is shown in Fig. 7. |
| In the text | |
Current usage metrics show cumulative count of Article Views (full-text article views including HTML views, PDF and ePub downloads, according to the available data) and Abstracts Views on Vision4Press platform.
Data correspond to usage on the plateform after 2015. The current usage metrics is available 48-96 hours after online publication and is updated daily on week days.
Initial download of the metrics may take a while.