Fig. 3
Download original image
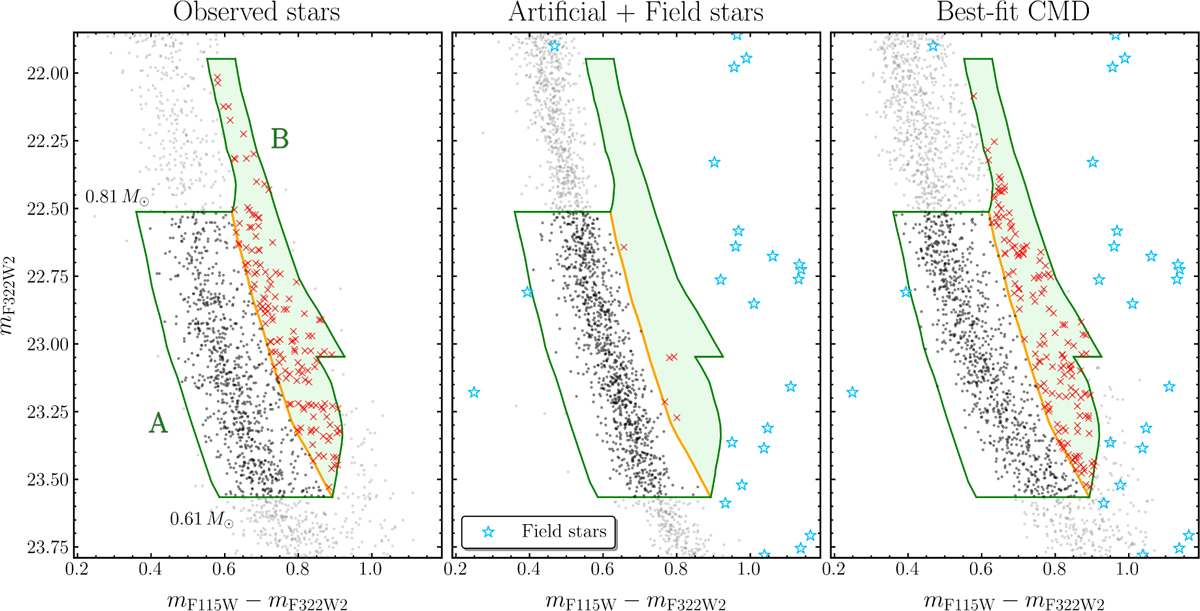
Binary fraction estimation in the SMC field. Left panel: mF322W2 vs. mF115W − mF322W2 CMD of SMC stars. Region A (green solid line) includes MS stars and binaries with primary masses between 0.61 and 0.81 M⊙. Region B (green-shaded area) contains binaries with q > 0.6. MS and binary stars are indicated with black points and red crosses, respectively, while the remaining stars are colored in gray. Central panel: Same as the left panel but for artificial and field stars. Azure star symbols represent stars simulated with the TRILEGAL code (Girardi et al. 2005) within a Galactic field with the same area and coordinates as the one investigated in this work. Right panel: Best-fit simulated CMD. Colors and symbols follow the same scheme as in the left and central panels.
Current usage metrics show cumulative count of Article Views (full-text article views including HTML views, PDF and ePub downloads, according to the available data) and Abstracts Views on Vision4Press platform.
Data correspond to usage on the plateform after 2015. The current usage metrics is available 48-96 hours after online publication and is updated daily on week days.
Initial download of the metrics may take a while.