Fig. 6
Download original image
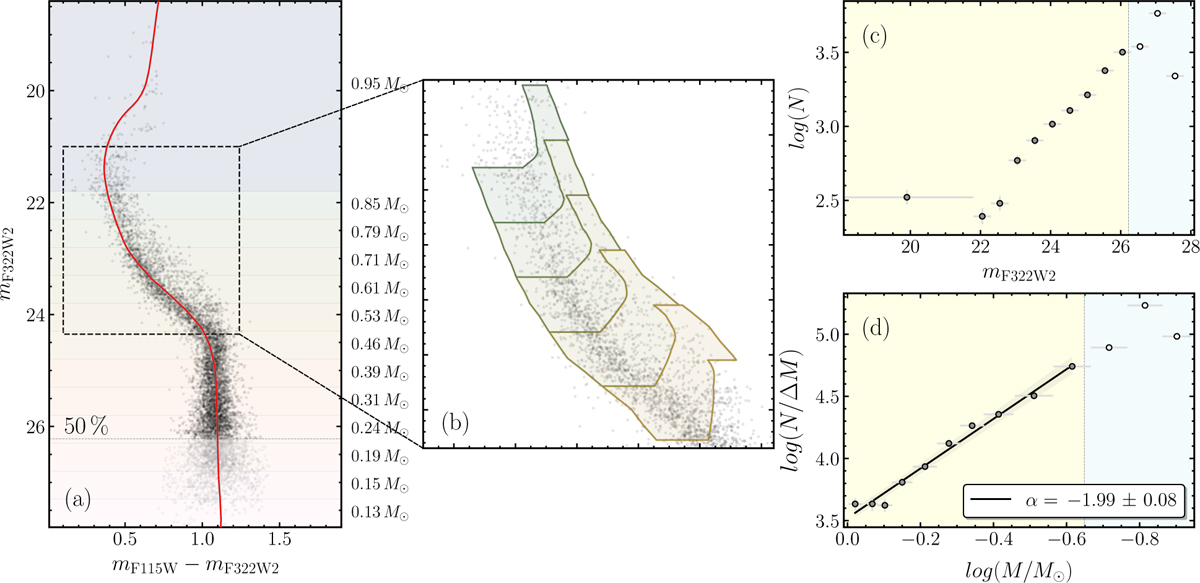
Determination of the SMC MF. Panel a: mF322W2 vs. mF115W − mF322W2 CMD for stars in the SMC. The magnitude intervals are highlighted in different colors, with the corresponding average stellar masses labeled on the right. The red solid line shows the isochrone that best fits the observed stellar population. Panel b: zoom-in of the CMD focusing on the magnitude range 21.0 < mF322W2 < 24.3. Colored regions indicate the bins used to compute the MF along the upper MS, tailored to include binary stars. Panels c and d: mF322W2 luminosity function (panel c) and corresponding MF (panel d) for SMC field stars. White points mark bins with photometric completeness below 50%. In panel d, the black solid line represents a linear fit to the observed MF, restricted to regions of the CMD where the photometric completeness exceeds 50%. The derived MF slope is indicated in the bottom-right corner of the figure. In all panels, the gray dashed line indicates the 50% completeness limit.
Current usage metrics show cumulative count of Article Views (full-text article views including HTML views, PDF and ePub downloads, according to the available data) and Abstracts Views on Vision4Press platform.
Data correspond to usage on the plateform after 2015. The current usage metrics is available 48-96 hours after online publication and is updated daily on week days.
Initial download of the metrics may take a while.