Fig. 7

Download original image
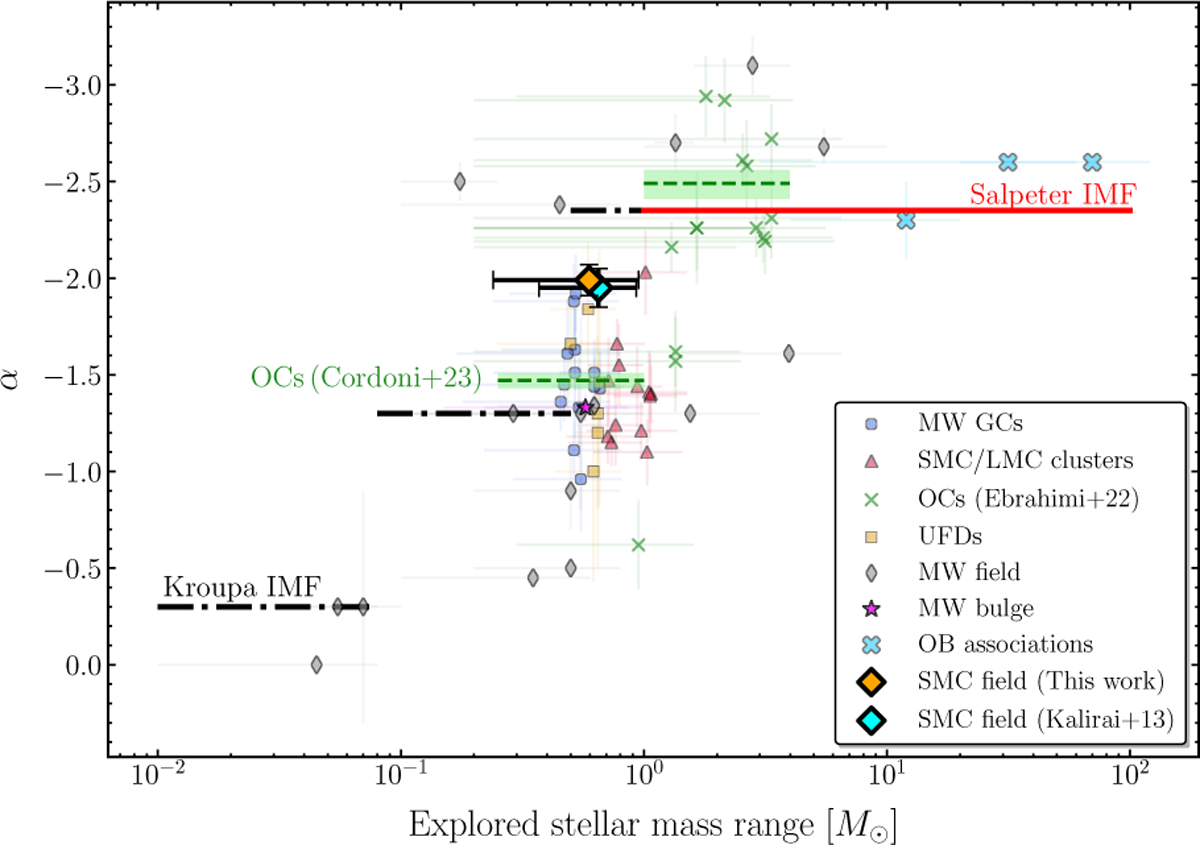
MF slope, α, as a function of the explored stellar mass range, compiled from a variety of Galactic and extragalactic environments. Each point represents the best-fit power-law slope over a specific mass range, with horizontal error bars showing the width of the corresponding mass interval. Blue circles denote Milky Way GCs, crimson triangles SMC and LMC clusters, thin green crosses OCs, gold squares UFDs, gray diamonds Milky Way field stars, the magenta star the Galactic bulge, and thick cyan crosses OB associations. The orange diamond shows the measurement for the SMC field from this work, and the nearby cyan diamond corresponds to the result from Kalirai et al. (2013). The solid red line marks the canonical Salpeter (1955) IMF slope, and the dashed black lines represent the segmented IMF slopes from Kroupa (2001). The green dashed line corresponds to the slopes measured by Cordoni et al. (2023) for Galactic OCs.
Current usage metrics show cumulative count of Article Views (full-text article views including HTML views, PDF and ePub downloads, according to the available data) and Abstracts Views on Vision4Press platform.
Data correspond to usage on the plateform after 2015. The current usage metrics is available 48-96 hours after online publication and is updated daily on week days.
Initial download of the metrics may take a while.


