Fig. 9
Download original image
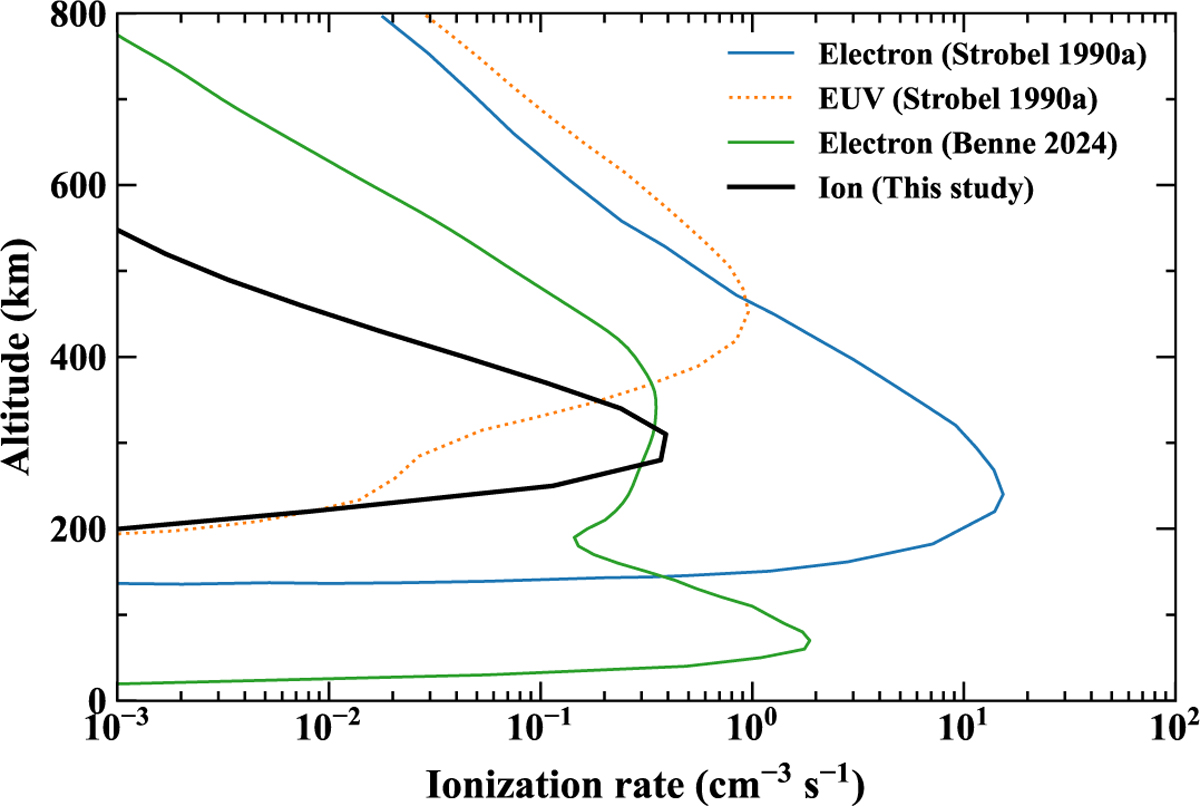
Ionization rate profiles in Triton’s atmosphere induced by three energy sources: solar EUV radiation, magnetospheric electron precipitation, and magnetospheric ion precipitation. The black curve represents our simulation results for ion-driven ionization For comparison, ionization rates from previous studies are shown: solar EUV-driven (orange) and electron-driven (blue) ionization from Strobel et al. (1990a), and electron-driven ionization (green) from Benne et al. (2024).
Current usage metrics show cumulative count of Article Views (full-text article views including HTML views, PDF and ePub downloads, according to the available data) and Abstracts Views on Vision4Press platform.
Data correspond to usage on the plateform after 2015. The current usage metrics is available 48-96 hours after online publication and is updated daily on week days.
Initial download of the metrics may take a while.