Fig. 1.
Download original image
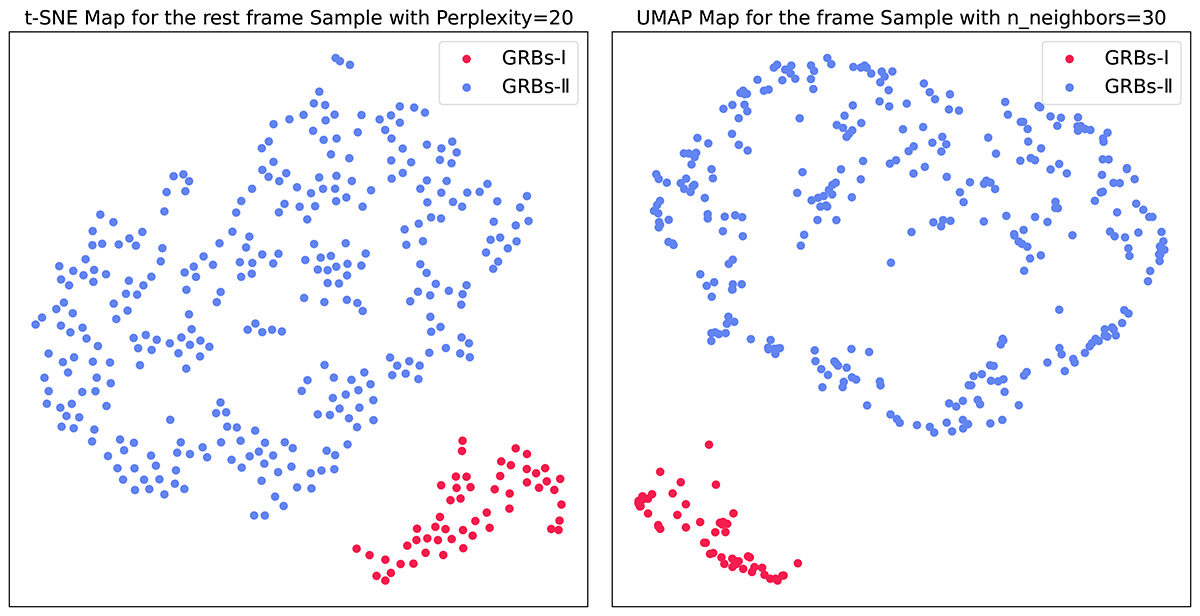
t-SNE (left) and the UMAP (right) 2D embedding of the 370 GRBs from the rest-frame sample based on T90, z, Ep, z, and Eiso. There are two clusters: one cluster with dots in red (GRBs-I) and the other cluster with dots in blue (GRBs-II). The axes resulting from t-SNE and UMAP have no clear physical interpretation or units, only the structure is meaningful.
Current usage metrics show cumulative count of Article Views (full-text article views including HTML views, PDF and ePub downloads, according to the available data) and Abstracts Views on Vision4Press platform.
Data correspond to usage on the plateform after 2015. The current usage metrics is available 48-96 hours after online publication and is updated daily on week days.
Initial download of the metrics may take a while.