Fig. 3.
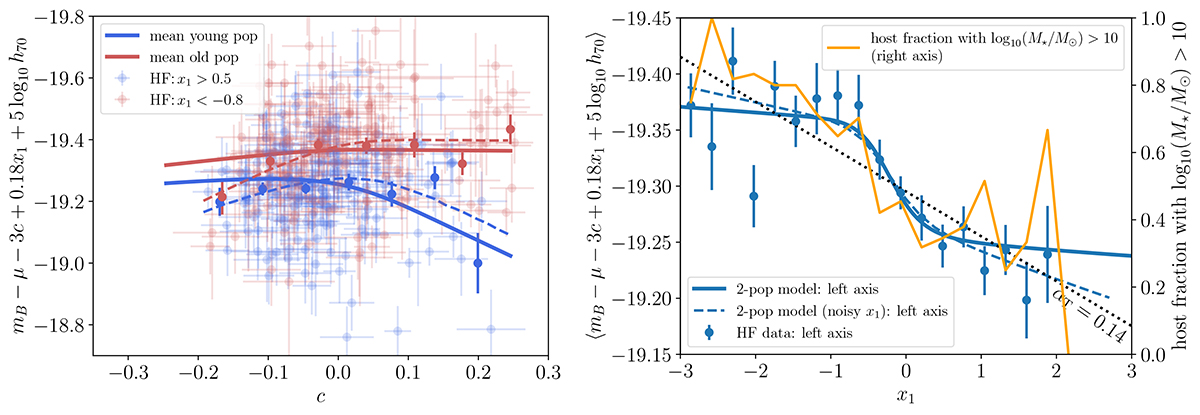
Download original image
Comparison between the best-fit two-population model and the supernova data in the Hubble flow. The panels show supernova absolute magnitudes obtained from the standard linear corrections in stretch and supernova colour as a function of the colour parameter (left) and the stretch parameter (right). For a more direct comparison with the noisy data, the dashed lines show the best-fit model predictions, which take into account noise due to measurement uncertainties (omitted for the solid lines). The data on the left panel are restricted to supernovae with x1 > 0.5 or x1 < −0.8 representing high-purity samples of the underlying young and old populations. The apparent difference between the slopes of the colour correction at c > 0 in the two populations reflects the difference in the derived mean extinction coefficients, RB. The right y-axis of the right panel shows the fraction of supernova host galaxies with log10(M⋆/M⊙) > 10. This demonstrates a close connection (although not equivalence) between the two-population model and the traditional mass-step correction (see also Briday et al. 2022; Wiseman et al. 2023). The old population is dominated by high-stellar-mass hosts, whereas the young population is widely distributed over host-galaxy stellar masses.
Current usage metrics show cumulative count of Article Views (full-text article views including HTML views, PDF and ePub downloads, according to the available data) and Abstracts Views on Vision4Press platform.
Data correspond to usage on the plateform after 2015. The current usage metrics is available 48-96 hours after online publication and is updated daily on week days.
Initial download of the metrics may take a while.