Fig. 5.
Download original image
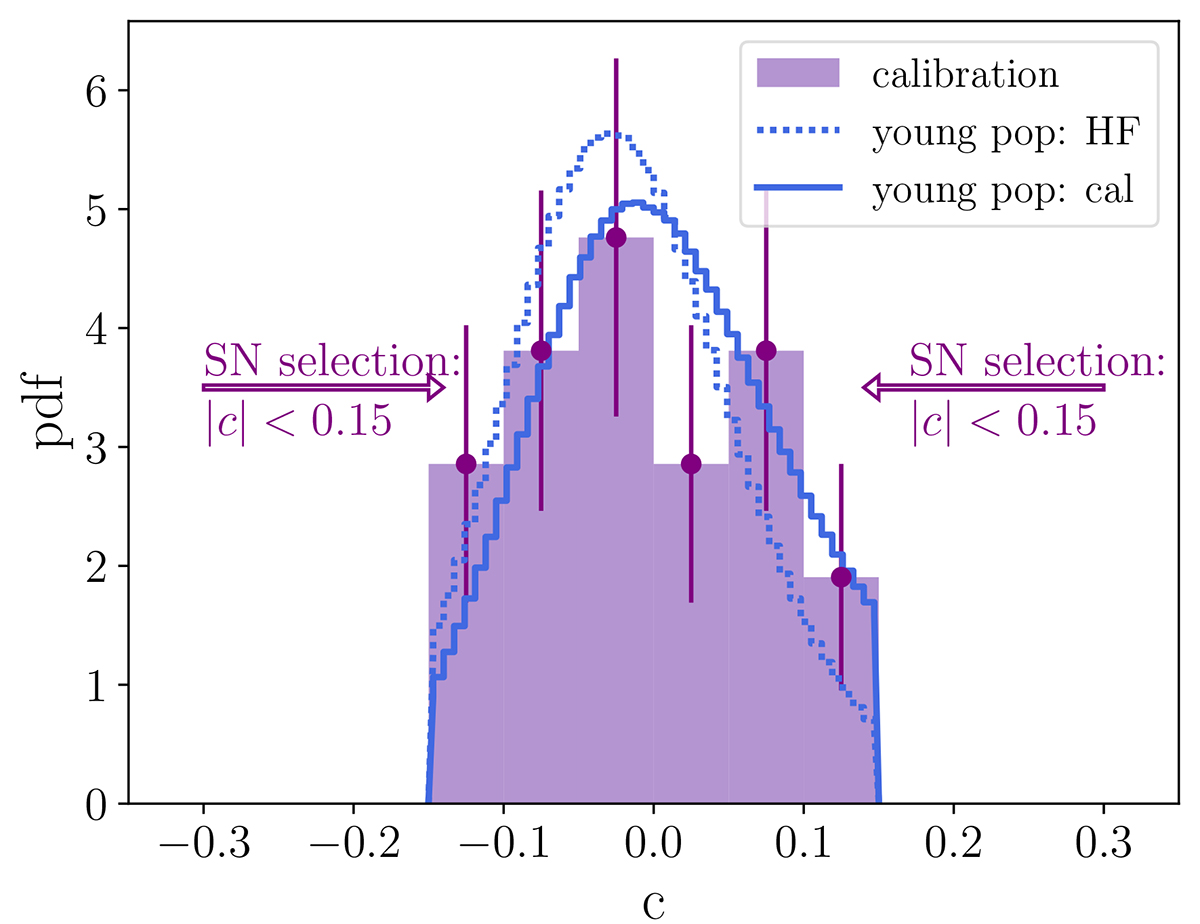
Comparison between the distribution of supernova colour parameters in the calibration sample and the best-fit model with the reddening scale, τ, measured either from the Hubble flow supernovae (model A) or from the calibration supernovae (model B). The best-fit reddening scale in the calibration sample is larger than in the Hubble flow, and this preference is driven by a higher fraction of reddened supernovae (c ∼ 0.1) than in the corresponding young population from the Hubble flow.
Current usage metrics show cumulative count of Article Views (full-text article views including HTML views, PDF and ePub downloads, according to the available data) and Abstracts Views on Vision4Press platform.
Data correspond to usage on the plateform after 2015. The current usage metrics is available 48-96 hours after online publication and is updated daily on week days.
Initial download of the metrics may take a while.