Fig. 4
Download original image
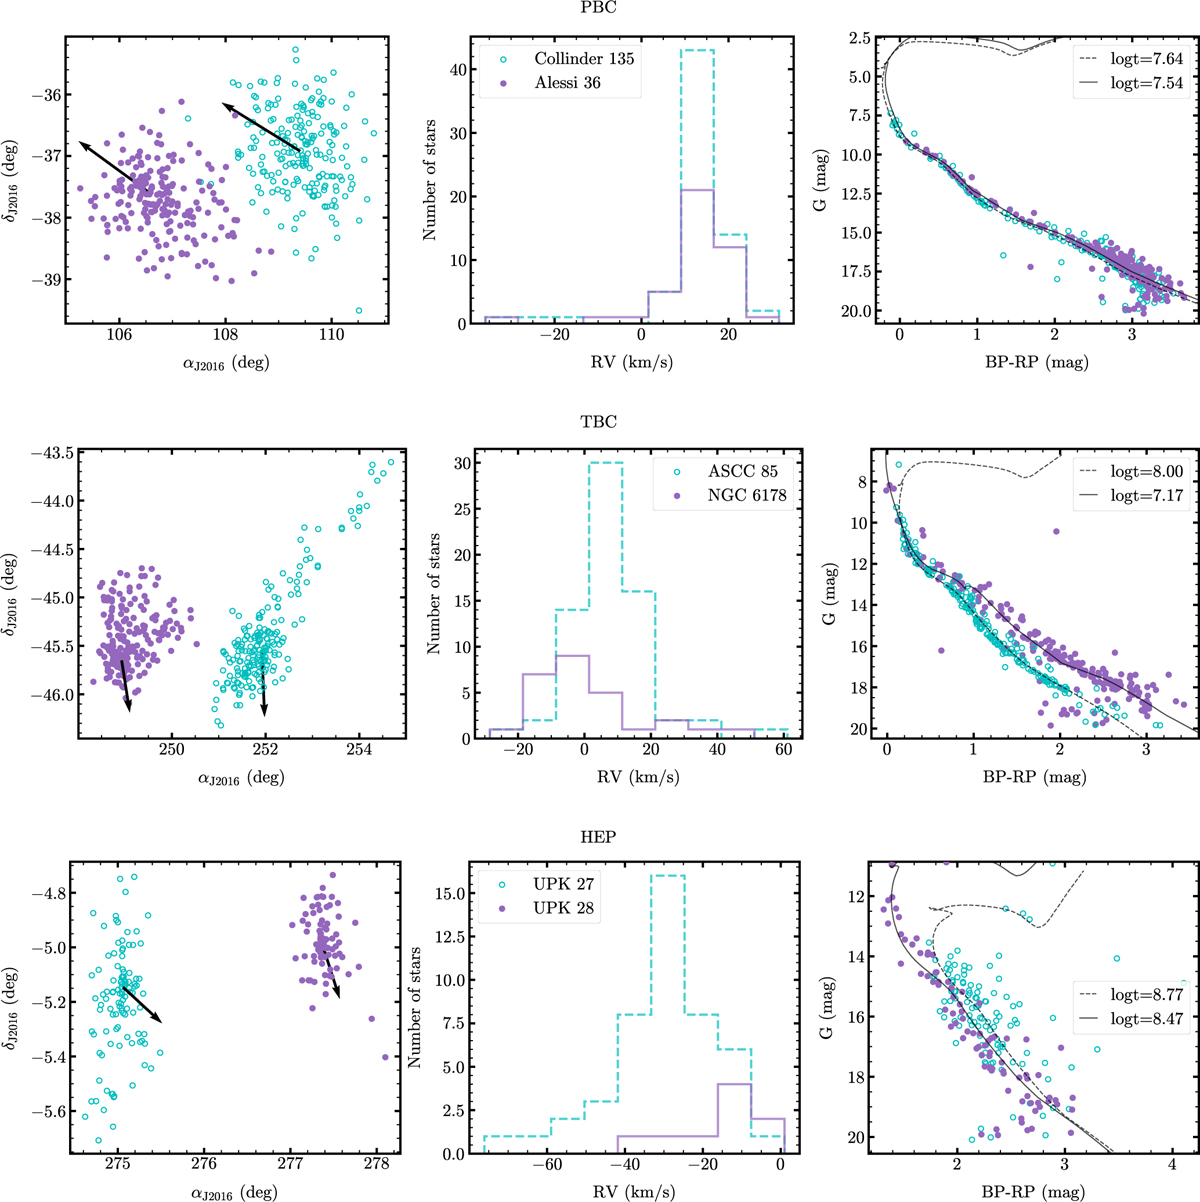
Multi-dimensional distributions of representative cluster pairs of different types. Shown are the distributions of member stars in spatial coordinates (left panel), radial velocity (middle panel), and color–magnitude diagram (CMD; right panel). Each point is colored according to the OC to which the star belongs. Arrows indicate the tangential velocities of the clusters; each cluster pair is plotted using a distinct velocity scale for clarity.
Current usage metrics show cumulative count of Article Views (full-text article views including HTML views, PDF and ePub downloads, according to the available data) and Abstracts Views on Vision4Press platform.
Data correspond to usage on the plateform after 2015. The current usage metrics is available 48-96 hours after online publication and is updated daily on week days.
Initial download of the metrics may take a while.