| Issue |
A&A
Volume 702, October 2025
|
|
|---|---|---|
| Article Number | A48 | |
| Number of page(s) | 10 | |
| Section | Galactic structure, stellar clusters and populations | |
| DOI | https://doi.org/10.1051/0004-6361/202556299 | |
| Published online | 06 October 2025 | |
Binary clusters in the Galactic I: systematic identification and classification using Gaia DR3
1
XinJiang Astronomical Observatory, Chinese Academy of Sciences,
150 Science 1-Street, Urumqi,
Xinjiang
830011,
China
2
School of Astronomy and Space Science, University of Chinese Academy of Sciences,
No. 19A, Yuquan Road,
Beijing
100049,
China
3
Astrophysics Division, Shanghai Astronomical Observatory, Chinese Academy of Sciences,
80 Nandan Road,
Shanghai
200030,
China
4
Institut de Ciències del Cosmos, Universitat de Barcelona (ICCUB),
Martí i Franquès 1,
08028
Barcelona,
Spain
★ Corresponding authors: This email address is being protected from spambots. You need JavaScript enabled to view it.
; This email address is being protected from spambots. You need JavaScript enabled to view it.
Received:
8
July
2025
Accepted:
4
August
2025
Abstract
Context. Binary clusters (BCs) provide valuable observational constraints on the formation, early evolution, and dynamical interactions of star clusters. Their spatial and kinematic associations offer unique insights into the hierarchical star formation process and tidal interactions within the Galactic disk.
Aims. Our aim was to identify and classify BCs using high-precision astrometric and kinematic data, and to investigate their physical properties, mutual gravitational interactions, and formation rates.
Methods. We used a comprehensive star cluster catalog that contains 4084 high-quality clusters. Based on spatial and kinematic proximity, we identified 400 cluster pairs involving 686 unique clusters. These pairs were classified into three types: primordial BCs, systems formed through tidal capture or resonant trapping, and hyperbolic encounter pairs. For each system, we calculated the tidal factor to quantify the strength of mutual tidal interaction. Additionally, we constructed multi-cluster systems by identifying transitive connections among cluster pairs.
Results. Among the 400 identified cluster pairs, nearly 60.8% (243 pairs) are probably primordial BCs, exhibiting similar ages and motions. This supports a scenario where they formed together in the same giant molecular cloud. We find that 82.5% of the cluster pairs have strong mutual tidal forces. In addition, 278 star clusters are identified as members of 82 multi-cluster systems, including 27 newly reported groups. Cross-matching with the literature confirmed the recovery of previously reported systems and led to the discovery of 268 new cluster pairs. In our sample, about 16.8% of the star clusters are involved in some type of interaction with another cluster, and 9.94% of star clusters were likely born in primordial BCs.
Conclusions. Our results provide a comprehensive homogeneously identified sample of Galactic BCs. The high fraction of primordial BCs and their mutual tidal interaction suggest that cluster formation in pairs is a main outcome of star formation. This work offers new observational constraints on the formation and dynamical evolution of multiple star cluster systems.
Key words: open clusters and associations: general
© The Authors 2025
 Open Access article, published by EDP Sciences, under the terms of the Creative Commons Attribution License (https://creativecommons.org/licenses/by/4.0), which permits unrestricted use, distribution, and reproduction in any medium, provided the original work is properly cited.
This article is published in open access under the Subscribe to Open model. This email address is being protected from spambots. You need JavaScript enabled to view it. to support open access publication.
1 Introduction
Open clusters (OCs) are stellar systems consisting of dozens to thousands of stars that form from the same giant molecular cloud (GMC) and remain gravitationally bound (Lada & Lada 2003). While most OCs exist as independent stellar systems, some form in groups, such as binary clusters (BCs) or more complex configurations involving multiple OCs (Conrad et al. 2017; Bica et al. 2003; Camargo et al. 2016; Liu et al. 2025). A well-known BC is the h and χ Persei pair (NGC 869 and NGC 884; Messow & Schorr 1913; Zhong et al. 2019), which illustrates the possibility of nearly coeval and physically associated clusters forming nearby.
Binary clusters offer unique insights into both the star formation processes and subsequent dynamical evolution in different Galactic environments. Their existence challenges the classical theory that star clusters form and evolve in isolation. Instead, it supports the idea that star formation may occur in a clustered or hierarchical formation mode (Bhatia & Hatzidimitriou 1988; Dieball et al. 2002; Liu et al. 2025), extending from small-scale associations to larger Galactic structures (Elmegreen & Efremov 1996).
The presence of BCs naturally raises questions about their origin. Several mechanisms have been proposed to explain the formation of interacting pairs (de La Fuente Marcos & de La Fuente Marcos 2009), each leading to different observable properties. In the simultaneous formation scenario, both clusters form nearly simultaneously within the same GMC. As a result, they typically have similar ages, chemical compositions, and kinematics. These systems are considered primordial BCs. In contrast, sequential formation involves one cluster triggering the formation of another through stellar feedback (Brown et al. 1995; Goodwin 1997), such as stellar winds or supernova explosions. Such pairs typically exhibit a small age difference and may or may not share similar kinematics, depending on whether they formed from the same GMC. Recent work by Liu et al. (2025) identified several primordial OC groups that likely formed through supernova-triggered sequential star formation, providing support for a hierarchical picture of clustered star formation regulated by stellar feedback within GMC environments. Another possibility is tidal capture or resonant trapping, where initially unrelated clusters become dynamically associated through gravitational interactions or resonances in the galactic potential. These systems exhibit similar motions but differ in age and composition (van den Bergh 1996; Dehnen 1998; De Simone et al. 2004). Therefore, they do not have a common origin. Lastly, some close cluster pairs may be optical doubles, which are only spatially proximate but kinematically unbound and unrelated; they may arise from projection effects or temporary flybys.
While the formation of BCs can be attributed to several distinct mechanisms, discriminating among them observationally requires accurate identification of physically associated cluster pairs. To investigate BCs in greater depth, it is first necessary to observationally confirm cluster pairs or multiple systems that exhibit kinematic correlations. Detection of multiple systems has been an area of interest since the 1990s, with significant advancements in the past decade. This effort has led to the development of several catalogs, each covering specific subsets of clusters based on particular selection criteria (e.g., de La Fuente Marcos & de La Fuente Marcos 2009; Soubiran et al. 2019; Piecka & Paunzen 2021; Casado 2021b; Song et al. 2022; Qin et al. 2023; Palma et al. 2025). In some instances, improved detection techniques and high-precision astrometric data have revealed that objects previously classified as single clusters are binary systems (e.g., Camargo 2021; Qin et al. 2025), thereby underscoring the limitations of earlier surveys. However, the variety of selection methods and datasets makes direct comparison between studies difficult.
Before the Gaia era, the limited precision of astrometric measurements made it a challenge to reliably identify member stars of OCs, thereby rendering the detection and characterization of BCs extremely difficult. Early efforts, such as Subramaniam et al. (1995), estimated that BCs accounted for approximately 8% of OCs by applying a spatial separation threshold of 20 pc and identifying 18 candidate pairs. Later, de La Fuente Marcos & de La Fuente Marcos (2009) adopted physical (rather than projected) separations, selecting pairs with distances below 30 pc as potential interacting systems. Their results suggested that at least 12% of OCs in the solar neighborhood are gravitationally interacting with nearby companions. Moreover, they proposed that the fraction of BCs in the Milky Way is comparable to that observed in the Magellanic Clouds, and approximately 40% of these binary systems may have a common origin. More recently, Conrad et al. (2017) were the first to utilize full 6D parameters (![Mathematical equation: $\[\alpha, \delta, \mu_{\alpha}^{*}, \mu_{\delta}, \varpi, \mathrm{RV}\]$](/articles/aa/full_html/2025/10/aa56299-25/aa56299-25-eq1.png) ) to systematically investigate the presence of BCs and OC groups. Using selection criteria of spatial separation threshold of 100 pc and velocity difference thresholds of 10 or 20 km s−1, they identified 14 pairs and five groups under the stricter threshold, and 31 pairs and five groups under the more relaxed condition.
) to systematically investigate the presence of BCs and OC groups. Using selection criteria of spatial separation threshold of 100 pc and velocity difference thresholds of 10 or 20 km s−1, they identified 14 pairs and five groups under the stricter threshold, and 31 pairs and five groups under the more relaxed condition.
The advent of Gaia data has dramatically transformed the study of OCs by providing high-precision astrometric data (![Mathematical equation: $\[\alpha, \delta, \varpi, \mu_{\alpha}^{*}, \mu_{\delta}\]$](/articles/aa/full_html/2025/10/aa56299-25/aa56299-25-eq2.png) ) alongside multi-band photometric data such as G, GBP, and GRP (Gaia Collaboration 2018, 2021, 2023). These data have enabled the identification of BCs with unprecedented accuracy. In recent years, significant progress has been made through increasingly refined selection methods. These advancements include approaches based solely on spatial proximity (Liu & Pang 2019) or spatial proximity combined with velocity consistency (Soubiran et al. 2019; Casado 2021b), as well as the incorporation of age similarity (Qin et al. 2023; Liu et al. 2025). Some approaches rely on shared member stars (Piecka & Paunzen 2021), while others integrate spatial proximity, proper motion similarity, and age agreement (Song et al. 2022; Li & Zhu 2025). In addition, tidal interaction indicators have recently been introduced as an auxiliary criterion for confirming BCs (Palma et al. 2025). The application of these improved techniques has not only enhanced the reliability of BC identification, but has also provided valuable insight into their connection with larger cluster groupings.
) alongside multi-band photometric data such as G, GBP, and GRP (Gaia Collaboration 2018, 2021, 2023). These data have enabled the identification of BCs with unprecedented accuracy. In recent years, significant progress has been made through increasingly refined selection methods. These advancements include approaches based solely on spatial proximity (Liu & Pang 2019) or spatial proximity combined with velocity consistency (Soubiran et al. 2019; Casado 2021b), as well as the incorporation of age similarity (Qin et al. 2023; Liu et al. 2025). Some approaches rely on shared member stars (Piecka & Paunzen 2021), while others integrate spatial proximity, proper motion similarity, and age agreement (Song et al. 2022; Li & Zhu 2025). In addition, tidal interaction indicators have recently been introduced as an auxiliary criterion for confirming BCs (Palma et al. 2025). The application of these improved techniques has not only enhanced the reliability of BC identification, but has also provided valuable insight into their connection with larger cluster groupings.
Despite increasing attention in recent years, the identification of BCs remains challenging. A key limitation originates from inconsistencies in selection criteria and OC catalogs used across different studies, which complicates the direct comparison and integration of results. To advance our understanding of their formation and evolution, a high-quality, large-sample, and methodologically uniform search for BCs and cluster groups is essential. In this study we independently identified new BCs and OC groups using a high-quality large-sample catalog of OCs. Our method incorporates full 6D phase-space information, as well as the age difference between each cluster and its nearest neighbor.
This paper is structured as follows. We describe the data, including the sources of the OC samples in Section 2. In Section 3 we present the procedures used to derive cluster parameters and the BC identification approach. The results of the BC search are given in Section 4. In Section 5 we compare our findings with previous studies and discuss the identification of OC groups within our sample. Finally, we summarize our conclusions in Section 6.
2 Data
We searched for BCs based on the homogeneous star cluster catalog published by Hunt & Reffert 2024 (hereafter HR24), which provides a comprehensive census of 7167 star clusters. Among these, 4782 are previously known star clusters compiled from the literature, and 2387 are newly identified. The cluster catalog provided by HR24 is an updated version of Hunt & Reffert 2023 (hereafter HR23), which was originally constructed from a systematic cluster search conducted in that study. To detect and recover these star clusters, HR23 employed the algorithm Hierarchical Density-Based Spatial Clustering of Applications with Noise (HDBSCAN; Campello et al. 2013). It is well suited for identifying star clusters of varying densities and effectively separating member stars from field star contamination.
However, a major limitation of HDBSCAN is the high false-positive rate. This is due to the overconfidence of HDBSCAN, which sometimes misidentifies random statistical fluctuations in dense stellar fields as genuine star clusters. To mitigate this, HR23 introduced the cluster significance test (CST), which evaluates the statistical contrast between cluster members and the surrounding field stars (Hunt & Reffert 2021). Specifically, it compares the nearest-neighbor distance distribution of star cluster members with that of nearby field stars. Star clusters with CST values greater than 5σ are considered to represent significant astrometric overdensities rather than random fluctuations, thus indicating genuine star clusters.
Hunt & Reffert (2023) also assessed star cluster quality using the color–magnitude diagram (CMD), based on the assumption that star clusters typically consist of stars formed in the same GMC, and thus have similar ages. This coeval population produces a well-defined sequence in the CMD. Thus, HR23 introduced a quality parameter called the CMD class, which is provided for each star cluster in the catalog. A star cluster with a median CMD class value above 0.5 is considered to be consistent with a single stellar population, and is thus more likely to be a real cluster. Combined with the CST, HR23 identified a reliable high-quality subsample of 4105 clusters that satisfy CST greater than 5σ and median CMD class greater than 0.5.
Among these, HR23 further distinguished between gravitationally bound systems, such as OCs and globular clusters, and unbound systems that are more compatible with moving groups (MGs). In addition, HR23 derived a set of fundamental parameters for each star cluster, including key astrometric parameters such as position (α, δ), proper motion (![Mathematical equation: $\[\mu_\alpha^*\]$](/articles/aa/full_html/2025/10/aa56299-25/aa56299-25-eq3.png) , μδ), parallax (ϖ), and radial velocity (RV).
, μδ), parallax (ϖ), and radial velocity (RV).
For our study we selected a high-quality sample of 4084 star clusters from a high-quality subsample provided by HR24, which includes both OCs and MGs. For each cluster, we used the full set of 6D phase-space parameters (![Mathematical equation: $\[\alpha, \delta, \mu_{\alpha}^{*}, \mu_{\delta}, \varpi, \mathrm{RV}\]$](/articles/aa/full_html/2025/10/aa56299-25/aa56299-25-eq4.png) ) provided by HR24, as well as the R50, defined as the radius containing 50% of the member stars.
) provided by HR24, as well as the R50, defined as the radius containing 50% of the member stars.
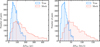 |
Fig. 1 Comparison of the distributions for the spatial separation and velocity difference of the nearest neighbors. The pink histogram is the result of one mock trial, while the blue histograms correspond to the results from our working sample. |
3 Identification criteria
We derived the parameters used in the identification process by computing the 3D positions, 3D velocities, and tangential velocities (Vt) for all star clusters. The value of Vt is obtained by converting proper motion measurements using the following equation:
![Mathematical equation: $\[V_t=k \times d \times P M.\]$](/articles/aa/full_html/2025/10/aa56299-25/aa56299-25-eq5.png) (1)
(1)
Here Vt is the tangential velocity in km s−1, k = 4.74 is the conversion factor to ensure unit consistency, PM is the proper motion component in mas yr−1, and d is the heliocentric distance of the clusters (in kpc). To determine the closest neighbor of each OC in 3D space, we converted the equatorial coordinates to galactocentric Cartesian coordinates using the Astropy package (Astropy Collaboration 2013, 2018). For the transformation, we adopted the position of Sun as (X, Y, Z) = [8, 0, 0.015] kpc and velocity as (U, V, W) = [10, 235, 7] km s−1 in the galactocentric reference frame (Bovy 2015).
Binary clusters are generally expected to show close spatial proximity and similar kinematics. Consequently, compared to random cluster pairs, their spatial separations and velocity differences should be significantly smaller than those of randomly associated cluster pairs (Conrad et al. 2017). We first investigated the statistical properties of spatial and kinematic proximity among OCs to establish reliable thresholds for identifying BCs.
To quantify this, we began with a sample of 4084 high-quality star clusters and performed a nearest-neighbor analysis in 3D space (X, Y, Z). For each star cluster, we identified its closest neighboring cluster and calculated the 3D spatial separation (ΔD3D) between them. We also computed their relative velocity difference, including the tangential velocity difference (ΔVt) and also full 3D velocity difference (ΔV3D). After removing duplicate pairs from the initial set of 4084 pairs, we obtained a final sample of 2974 unique cluster pairs. The distributions of ΔD3D and ΔV3D of 2974 pairs are shown in Fig. 1. The ΔD3D distribution exhibits a prominent peak at 50 pc, while the ΔV3D distribution peaks at approximately 20 km s−1. These peak values represent the typical characteristics of physically associated cluster pairs.
To test the robustness of ΔD3D and ΔV3D statistical distribution, we constructed a mock dataset by randomly assigning the 6D parameters (![Mathematical equation: $\[\alpha, \delta, \mu_{\alpha}^{*}, \mu_{\delta}, \varpi, \mathrm{RV}\]$](/articles/aa/full_html/2025/10/aa56299-25/aa56299-25-eq6.png) ) from real star clusters to generate artificial mock clusters. Specifically, for each mock star cluster, we independently sampled each parameter from the distributions of the real 4084 star clusters, thereby preserving the marginal distributions but destroying any intrinsic correlations. This process yielded a mock catalog of 4084 star clusters.
) from real star clusters to generate artificial mock clusters. Specifically, for each mock star cluster, we independently sampled each parameter from the distributions of the real 4084 star clusters, thereby preserving the marginal distributions but destroying any intrinsic correlations. This process yielded a mock catalog of 4084 star clusters.
We then performed a nearest-neighbor search for each mock OCs and calculated the ΔD3D and ΔV3D between each mock pair. This procedure was repeated over 1000 independent trials, each using a newly generated mock catalog with randomized parameters. Fig. 1 presents the results of one of these trials, where the distribution of ΔD3D and ΔV3D of the mock dataset is significantly broader than that of the real data. While Fig. 2 shows the distribution of peak values from the entire set of 1000 trials, the mock dataset yields a typical ΔD3D of approximately 80 pc between nearest-neighbor pairs, and a typical ΔV3D of about 40 km s−1. The two values are significantly higher than the peaks observed in the real data. The larger values obtained from the simulations are likely a result of the random assignment disrupting the original kinematic coherence present in the real data, which is attributed to gravitational interaction. This leads to a more uniform distribution of positions and velocities, producing greater separations and velocity differences in the absence of physical associations. In contrast, the tighter distribution observed in the real sample indicates an intrinsic connection between OC pairs. This result demonstrates high statistical significance and confirms that ΔD3D below 50 pc and a ΔV3D below 20 km s−1 are meaningful thresholds likely corresponding to genuine BC systems rather than chance alignments. This result supports the use of ΔD3D threshold of 50 pc and a ΔV3D threshold of 20 km s−1 as effective criteria for identifying physically bound or primordial BC systems.
The identification process benefits from the inclusion of the ΔVt, which constrains the alignment of velocity vectors between OCs and strengthens the detection of systems with coherent motion. Since nearly 27% of OCs in the high-quality sample lack sufficient RV data (i.e., NRV ≤ 1), which makes it difficult to compute accurate ΔV3D for all candidate pairs. To address this limitation, the Vt component serves as an alternative kinematic indicator. Following previous studies (e.g., Conrad et al. 2017; Qin et al. 2023; Liu et al. 2025), we applied an empirical threshold of ΔVt < 10 km s−1.
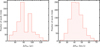 |
Fig. 2 Distribution of peak values of spatial separation and velocity difference for nearest neighbors in 1000 mock trials. |
4 Results
4.1 Identification of BC candidates
We first selected cluster pairs with ΔD3D < 50 pc and ΔVt < 10 km s−1. This initial selection yielded a sample of 400 candidate BCs with close proximity and coherent tangential velocity. To further assess the reliability of these candidate BCs, we evaluated the availability of RV data for both member clusters. Based on this, we divided the 400 candidates into two categories: – Golden Sample: pairs in which both member star clusters have a sufficient number of stars with measured radial velocities. Specifically, we require that each cluster in the pair has at least ten member stars with available RV measurements. Pairs failing to meet this criterion are excluded from the golden sample.
– Full Sample: pairs that satisfy the ΔD3D and ΔVt thresholds, but lack sufficient RV data in at least one member OC (i.e., fewer than ten stars with RVs). Although ΔV3D cannot be reliably computed for these systems, their spatial proximity and aligned tangential velocity suggest a likely physical association.
Based on this criterion, we identified 146 pairs as the high-quality golden sample and 254 pairs as the full sample, which is shown in Fig. 3. This division enables a distinction between robust, fully characterized BCs and those that remain plausible but less certain due to incomplete velocity information.
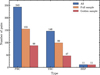 |
Fig. 3 Distribution of different types of cluster pairs and sample category. The blue bars represent the total number of pairs in each type of cluster pair, the orange bars indicate those in the full sample, and the red bars correspond to the golden sample. The numbers above each bar indicate the total number of pairs in that subcategory. Cluster pair types include primordial binary clusters (PBCs), tidal capture or resonant trapping binary clusters (TBCs), and hyperbolic encounter pairs (HEPs), as defined in Section 4.2. |
4.2 Classification of BCs
To further classify the 400 candidate BCs, we considered the age difference (ΔAge) between the member OCs. The member OCs typically have similar ages for BCs with a common origin, while sequentially formed pairs may exhibit a small but non-negligible age difference. If the secondary cluster forms within the same molecular cloud as the primary, the two OCs are expected to share similar kinematic properties. In such scenarios, the pair can still be considered to have a common origin and classified as a primordial BC system.
Previous studies proposed different thresholds for the ΔAge between member OCs of BC. For example, de La Fuente Marcos & de La Fuente Marcos (2009) adopted a limit of 50 Myr, while Qin et al. (2023); Liu et al. (2025) used a stricter criterion of 30 Myr. Following this precedent, we adopted 30 Myr as the criterion for identifying cluster pairs with a common origin. Based on these analyses, we classified the BC candidates into the following categories:
-
Primordial binary clusters (PBCs): The member OCs have similar ages and share common kinematics, consistent with formation from the same GMC. In this study, a PBC is defined using the following criteria:
ΔV3D ≤ 20 km s−1;
ΔAge ≤ 30 Myr.
These criteria ensure that the member OCs are not only kinematically associated, but also likely coeval, supporting a common origin scenario.
Tidal capture or resonant trapping binary clusters (TBCs): These cluster pairs occupy a limited volume of space and exhibit similar kinematics, but their ages differ significantly. The dynamical association is likely due to gravitational interactions such as tidal capture or resonant trapping rather than a common formation history. The classification is based on the following criteria:
ΔV3D ≤ 20 km s−1;
ΔAge > 30 Myr.
Hyperbolic encounter pairs (HEPs): These are cluster pairs that are spatially close, but have significantly different velocities, indicating that they were not born gravitationally bound. Other physical properties such as age or metallicity may also differ. These are characterized by the following criterion:
ΔV3D > 20 km s−1.
To apply this classification scheme, we performed isochrone fitting for 400 pairs of BC candidates to obtain accurate age estimates. We performed isochrone fitting on the CMD of each target OC, using theoretical isochrones from the Gaia photometric system provided by CMD 3.71 (Bressan et al. 2012; Chen et al. 2015; Marigo et al. 2017). The best-fit isochrone was determined through visual inspection of a series of isochrone fits spanning a logarithmic age range of log(Age[yr]) = 6 to 10, with intervals of 0.01, and a metallicity value of solar metallicity (Z⊙=0.0152, Caffau et al. 2011).
Based on the classification approach described above, we classified the 400 candidate BCs into three types. Fig. 4 presents representative examples of the three types. In both the PBC and TBC examples, the member OCs are spatially close and kinematically similar. The key distinguishing factor is their age. The member OCs of PBCs have nearly identical ages, while members of TBCs show clear age differences. By contrast, HEPs exhibit large RV differences, indicating they are not coevally associated despite their spatial proximity.
The classification results are presented in Fig. 3. A total of 243 pairs are identified as PBCs, accounting for approximately 60.8% of all BC candidates. This high proportion suggests that the majority of BC systems are likely to have formed together. Among them, 88 pairs belong to the golden sample, while 155 pairs come from the full sample. In addition, 146 pairs are classified as TBCs, including 47 golden sample pairs and 99 full sample pairs. The properties of all BC systems are summarized in Table 2.
5 Discussion
5.1 Tidal force
We estimated the mutual tidal force between members in each pair using the tidal factor (TF), following the method of Palma et al. (2025) (hereafter P25), where TF serves as a reciprocal proxy for the strength of the tidal force. Since the TF serves as the reciprocal proxy of the tidal force, each pair is assigned two TF values, and a lower TF value indicates a stronger tidal force exerted by the companion cluster. The TF is calculated as follows:
![Mathematical equation: $\[T F=\frac{d^3}{M_{c l} R_{50}},\]$](/articles/aa/full_html/2025/10/aa56299-25/aa56299-25-eq7.png) (2)
(2)
where d is the 3D separation between the members in units of pc, R50 is the half-member radius of the target OC in pc, and Mcl is the mass of the companion OC in solar masses. To obtain the mass of each OC, we determine the nearest point on the best-fit isochrone (Section 4.2) and assign the corresponding mass as the star mass. The total OC mass is calculated by summing the masses of all member stars.
By computing the TF distribution for previously reported BC samples, P25 found that most cluster pairs classified as binary or group systems have spatial separations concentrated around 50-100 pc, and TF values typically below ~250. Based on this, P25 proposed TF < 200 as a threshold for identifying BCs. To quantify the tidal interaction between BCs, we also used the threshold TF < 200 to signify a significant tidal force between clusters. Specifically, a pair is considered to exhibit tidal interaction when at least one cluster in a pair has a TF below this threshold.
Using the TF metric, we found that the vast majority of identified BCs exhibit pronounced tidal interactions. Out of 400 candidate BCs in our sample, 330 pairs (82.5%) have TF < 200, indicating a significantly high tidal force between the components. Among them, 207 pairs are classified as PBCs, 114 as TBCs, and 9 as HEPs. The prevalence of low TF values among PBCs and TBCs strongly suggests that these systems are physically interacting: their mutual tidal forces are high, consistent with the expectation that they were either born together or are bound by gravity. In such pairs, the gravity from the companion OC is actively influencing the other OC, for example, by tidally distorting the outer regions or facilitating mass exchange between the clusters. The independently identified BCs in this study are largely validated as physically interacting pairs under the tidal factor criterion proposed by P25, either through a common origin or dynamical capture. Even in the few HEP systems that show TF < 200, the low TF implies a transient but significant tidal effect. In these cases, even without strong kinematic alignment, spatial proximity may still lead to a transient tidal force. This is an important distinction: HEPs are not long-term bound binaries, yet a sufficiently close approach can temporarily mimic the tidal influence seen in true bound pairs. Thus, a low TF can occur not only in enduring BC systems but also during short-lived encounters, highlighting that strong tidal forces can arise whenever two clusters come within a critical range, even if they will eventually separate.
To gain deeper insight into the physical conditions governing tidal interactions, the relationship between the tidal factor, spatial separation, and mass ratio of cluster pairs was investigated as these parameters jointly affect the strength of gravitational interaction. Fig. 5 presents a comparison of the BCs identified in this work with and without significant tidal interaction (defined as TF < 200), illustrating how tidal effects vary with spatial separation and relative OC mass. Notably, no clear correlation is found between the tidal factor and the mass ratio, suggesting that the presence of tidal interaction is primarily governed by spatial proximity rather than the relative mass of the OC. A distinct boundary is observed in which nearly all BCs with ΔD3D < 22 pc exhibit TF values below 200, indicating uniformly strong mutual gravitational influence. This suggests that such close pairs are almost inevitably subject to significant tidal interactions, with forces strong enough to bind or substantially perturb one another. For cluster pairs with ΔD3D ≳ 22 pc, a mixture of tidal environments is observed. Some pairs still exhibit TF < 200, whereas an increasing fraction display higher TF values indicative of weaker mutual interactions. This suggests that beyond this separation, spatial proximity alone is insufficient to guarantee strong tidal coupling between clusters.
To test the generality of this distance-dependent trend, we extended the analysis to all 716 cluster pairs with ΔD3D < 50 pc, including both the pairs identified as BCs in this work and those not selected. For the 316 non-selected pairs, we calculated the TF using cluster masses from HR24. This extended sample allowed us to construct a complete TF distribution for all close pairs. As shown in Fig. 5, nearly all cluster pairs with ΔD3D < 22 pc yielded TF < 200, reinforcing the idea that at sufficiently small separations, significant tidal forces are almost ubiquitous. This clear dependence on separation indicates that tidal forces become stronger as clusters move closer together, such that nearly all pairs with ΔD3D < 22 pc experience significant tidal interaction. These findings further justify the adoption of TF < 200 as a physically motivated threshold, effectively identifying pairs that lie within the critical regime of mutual gravitational influence.
Potential uncertainties in the TF calculation should be acknowledged in this work. The OC masses used in our analysis are derived from robust isochrone fits. However, unresolved binary stars and the missing faint member stars are not fully accounted for when summing member masses. As a result, TF values are likely conservative, which means the true tidal factors could be slightly overestimated (underestimated tidal force). Consequently, some cluster pairs marginally above the threshold could satisfy TF < 200 if better mass estimates were available. Overall, these uncertainties do not affect the general conclusion that the majority of close cluster pairs exhibit significant tidal interaction.
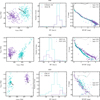 |
Fig. 4 Multi-dimensional distributions of representative cluster pairs of different types. Shown are the distributions of member stars in spatial coordinates (left panel), radial velocity (middle panel), and color–magnitude diagram (CMD; right panel). Each point is colored according to the OC to which the star belongs. Arrows indicate the tangential velocities of the clusters; each cluster pair is plotted using a distinct velocity scale for clarity. |
Compilation of multiple systems reported in the literature.
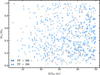 |
Fig. 5 Mass ratio vs. spatial separation for pairs with ΔD3D ≤ 50. The gray symbols represent pairs from the initial sample, while the blue symbols represent cluster pairs identified in this work. Circles indicate pairs with TF values lower than 200, and triangles indicate those with TF values greater than 200. |
5.2 Comparison with the literature
Cross-matching our identified cluster pairs with previously reported BCs provides a powerful way to validate the effectiveness of our identification methodology. The most famous BC is the h and χ Persei pair (NGC 869 and NGC 884; Messow & Schorr 1913; Zhong et al. 2019), which serves as a valuable benchmark for testing identification results. However, this pair is not included in our golden sample because their mean RV are based on only two and six member stars, respectively, making the measurements less reliable. Nevertheless, they are included in our full sample, suggesting that using Vt is effective for identifying BCs when reliable RVs are unavailable.
Building on this case, we expanded our validation by performing a comprehensive cross-match with previously reported BC samples. We first compiled the sample from the literature, which includes nearly 800 pairs listed in Table 1. These catalogs in Table 1 encompass diverse datasets and reflect the evolving approaches to identifying and analyzing these systems. We then cross-matched these literature samples with our BCs. We found that 230 pairs show partial overlap with literature-reported BCs, among which 132 pairs are in exact agreement.
Fig. 6 summarizes the overlap between cluster pairs identified in this work and those reported in the literature, categorized by BC type. Among the 243 PBCs, 70 match previously known systems, while 173 (71.2%) are newly identified. For the 146 TBCs, 60 are duplicates and 86 are new. In the HEP category, only 2 of the 11 systems were previously reported as BCs. These results confirm that our method is capable of recovering known binary systems with high reliability, while also discovering a large number of new physically associated pairs, particularly in the primordial BCs. This significantly expands the available BC sample in the Milky Way.
To comprehensively evaluate the coverage of literature samples, we compared the 800 previously reported BC pairs with our set of 2974 nearest-neighbor OC pairs. We found that 1123 of our pairs show partial overlap with literature-reported systems, of which 275 pairs are exact matches. Fig. 7 shows the distributions of ΔD3D, ΔVt, and ΔV3D for these 275 pairs. It can be seen that the matched candidates not included in our BC sample have larger velocity differences, highlighting differences in the velocity selection criteria used and the impact of our stricter kinematic selection criteria.
Among the overlapping systems, 252 pairs originate from the catalog of P25, representing the largest source of overlap. Accordingly, this dataset serves as the primary basis for comparison. P25 constructed a catalog of 617 cluster pairs using the same HR23 and HR24 data, but adopted a different selection approach that contains 53 genetic BCs, 88 formed through tidal capture or resonant trapping, and 476 classified as optical pairs, likely arising from gravitational (hyperbolic) encounters.
The discrepancy between our results and those of P25 primarily arises from differences in both the OC sample and the selection criteria. Although both studies utilize data from HR23 and HR24, our search is based on the high-quality subset of star clusters defined in HR24. In contrast, P25 includes 7046 entries from the HR24 catalog. As a result, the nearest neighbor of a given OC may differ from that in previous works, leading to reassignments, and only partial overlap with earlier catalogs. For example, some pairs previously identified as BCs may now be re-matched with newly added closer neighbors in our sample. Notably, many of these low-quality star clusters are not particularly scientifically useful for studies of star clusters, as they cannot be validated as real with the currently available data (Hunt & Reffert 2024).
Despite these differences, the overlap with previously reported systems provides strong support for the reliability and effectiveness of our identification method. This result demonstrates that our method is effective in identifying previously reported BCs. Our work not only recovers a large fraction of previously reported systems, but also contributes 268 newly identified physical BCs to the Galactic sample.
Based on our results, approximately 16.80% of OCs appear to be experiencing some type of interaction with a companion cluster, and 9.94% likely formed as PBCs that formed together in the same GMCs. These fractions are in good agreement with previous theoretical and observational estimates of 8-20% for the BC occurrence rate in the Milky Way (e.g., Subramaniam et al. 1995; Priyatikanto et al. 2019; de La Fuente Marcos & de La Fuente Marcos 2009; Casado 2021a).
Binary cluster candidates.
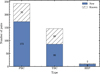 |
Fig. 6 Cross-matching results with previous studies. Distribution of BC candidates by classification type (PBC, TBC, HEP) showing the number of systems that are new (blue) vs. those previously reported in the literature (filled). |
5.3 OC groups
Based on the BC sample, we identified OC groups using the principle of transitivity, following the method introduced by Piecka & Paunzen (2021). Specifically, if Cluster A and Cluster B form a BC, and Cluster B and Cluster C also form a BC, then Clusters A, B, and C are considered members of the same group. Applying this transitive criterion to our BC sample, we identified a total of 278 clusters involved in multi-cluster systems, resulting in 82 distinct OC groups. Among these, 60 are triple-cluster systems, 12 are quadruple systems, 3 are quintuple systems, 3 are sextuple systems, and 1 is a septuple system. The results are shown in Fig. 8, and the properties of all OC groups are summarized in Table 3.
To assess the novelty and completeness of our group catalog, we cross-matched our identified OC groups with approximately 330 previously reported groups, which are compiled in Table 1. The results of this comparison are summarized as follows:
– Complete matches were found for 29 groups, including 28 from P25 and 1 from Liu & Pang (2019). These overlapping systems mostly consist of small groups: 22 triple-cluster systems, 4 quadruple systems, and 1 sextuple system.
– Subset matches were identified in 26 additional groups. In these cases, one group is entirely contained within the other, meaning that either a literature-reported group is fully embedded in a larger group from our catalog or our identified group is entirely included within a larger group reported in the literature. After excluding these 55 overlapping cases, our study reports 27 newly identified OC groups. These systems provide further support for the hierarchical star formation scenario, extending it from small-scale OCs or BCs to larger-scale structures (Elmegreen & Efremov 1996).
Open cluster group candidates.
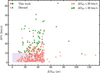 |
Fig. 7 Spatial separation as a function of tangential velocity for all matched cluster pairs from the literature. Circles denote BC candidates confirmed in this work, while triangles represent discarded pairs. The red symbols represent pairs with ΔV3D ≤ 20 km s−1, and green symbols indicate those with ΔV3D > 20 km s−1. The shaded region marks the selection range adopted for our BC sample. |
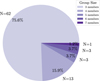 |
Fig. 8 Pie chart showing the number of star clusters in each group (see inset for color-coding by number of group members). |
6 Summary
In this study, we presented a comprehensive search and classification of BCs in the Milky Way based on a high-quality sample of 4084 star clusters from the HR24 catalog. To define robust identification criteria, we analyzed the nearest-neighbor distributions of spatial and velocity separations among OCs, and constructed mock datasets to assess the statistical significance of clustering. These tests support selection thresholds of ΔD3D ≤ 50 pc and ΔV3D ≤ 20 km s−1. To further include pairs lacking reliable radial velocities and also constrain the velocity vector, we adopted a ΔVt threshold of 10 km s−1, following previous studies. Based on these criteria, we first identified 400 candidate BCs with ΔD3D ≤ 50 pc and ΔVt ≤ 10 km s−1, which we define as the full sample. Among them, 146 pairs also meet the 3D velocity criterion and constitute the golden sample.
We classified 400 BC candidates into three types based on age and kinematic consistency. There are 243 PBCs, accounting for 60.8% of the sample. These PBCs have similar ages and motions, suggesting the member OCs formed together in the same GMC. Another 146 pairs are TBCs, with similar motions but different ages, likely formed through a sequential mode. The remaining 11 pairs are HEPs. They are close in space, but have large velocity differences, indicating they were not born physically bound.
We further calculate the TF for each pair and find that 82.5% of our BCs satisfy TF < 200, reinforcing the physical association of the majority of the sample. Additionally, we identify 278 clusters belonging to 82 OC groups, suggesting a hierarchical formation structure. In addition, 278 star clusters are identified as members of 82 multi-cluster systems, including 27 newly reported OC groups. These groups exemplify the hierarchical star formation scenario from small-scale BCs to larger-scale structures.
Cross-matching with about 800 BCs reported in the literature confirms that our methodology recovered 132 previously known pairs and has contributed 268 newly identified systems. We estimate that 16.80% of OCs are currently part of BC or group systems, and 9.94% likely formed as PBCs. These values are consistent with prior theoretical predictions and observational estimates. Our work provides a homogeneous and statistically robust catalog of BCs, offering a foundation dataset for future studies of hierarchical star formation, stellar feedback, and dynamical evolution within the Galactic disk.
Data availability
The full Tables 2 and 3 are available at the CDS via https://cdsarc.cds.unistra.fr/viz-bin/cat/J/A+A/702/A48
Acknowledgements
We are grateful to the anonymous referee for valuable comments that significantly improved the quality of this paper. We also thank Shiyin Shen and Ruqiu Lin for their insightful discussions and constructive suggestions. Y.Z. acknowledges the support from the science research grants from the Chinese Academy of Sciences (CAS) “Light of West China” Program (No. 2022-XBQNXZ-013), Central Guidance for Local Science and Technology Development Fund (No. ZYYD2025QY27), and Natural Science Foundation of Xinjiang Uygur Autonomous Region (No. 2022D01E86). This work is supported by the National Natural Science Foundation of China (NSFC) through the grants 12090040 and 12090042. J.Z. would like to acknowledge the science research grants from the China Manned Space Project with NO. CMS-CSST-2025-A19, the Youth Innovation Promotion Association CAS, the Science and Technology Commission of Shanghai Municipality (Grant No.22dz1202400), and the Program of Shanghai Academic/Technology Research Leader. S.Q. and Y.J. acknowledge financial support from the China Scholarship Council (Grant Nos. 202304910547 and 202404910435, respectively). This work has made use of data from the European Space Agency (ESA) mission Gaia https://www.cosmos.esa.int/gaia, processed by the Gaia Data Proces-Processingalysis Consortium (DPAC, https://www.cosmos.esa.int/web/gaia/dpac/consortium). Funding for the DPAC has been provided by national institutions, in particular, the institutions participating in the Gaia Multilateral Agreement.
References
- Angelo, M. S., Santos, J. F. C., Maia, F. F. S., & Corradi, W. J. B. 2022, MNRAS, 510, 5695 [CrossRef] [Google Scholar]
- Astropy Collaboration (Robitaille, T. P., et al.) 2013, A&A, 558, A33 [NASA ADS] [CrossRef] [EDP Sciences] [Google Scholar]
- Astropy Collaboration (Price-Whelan, A. M., et al.) 2018, AJ, 156, 123 [Google Scholar]
- Beccari, G., Boffin, H. M. J., & Jerabkova, T. 2020, MNRAS, 491, 2205 [Google Scholar]
- Bhatia, R. K., & Hatzidimitriou, D. 1988, MNRAS, 230, 215 [NASA ADS] [Google Scholar]
- Bica, E., Bonatto, C., & Dutra, C. M. 2003, A&A, 405, 991 [NASA ADS] [CrossRef] [EDP Sciences] [Google Scholar]
- Bovy, J. 2015, ApJS, 216, 29 [NASA ADS] [CrossRef] [Google Scholar]
- Bressan, A., Marigo, P., Girardi, L., et al. 2012, MNRAS, 427, 127 [NASA ADS] [CrossRef] [Google Scholar]
- Brown, J. H., Burkert, A., & Truran, J. W. 1995, ApJ, 440, 666 [NASA ADS] [CrossRef] [Google Scholar]
- Caffau, E., Ludwig, H. G., Steffen, M., Freytag, B., & Bonifacio, P. 2011, Sol. Phys., 268, 255 [Google Scholar]
- Camargo, D. 2021, ApJ, 923, 21 [NASA ADS] [CrossRef] [Google Scholar]
- Camargo, D., Bica, E., & Bonatto, C. 2016, MNRAS, 455, 3126 [Google Scholar]
- Campello, R. J. G. B., Moulavi, D., & Sander, J. 2013, Advances in Knowledge Discovery and Data Mining, 7819, 160 [Google Scholar]
- Cantat-Gaudin, T., Mapelli, M., Balaguer-Núñez, L., et al. 2019, A&A, 621, A115 [NASA ADS] [CrossRef] [EDP Sciences] [Google Scholar]
- Casado, J. 2021a, Res. Astron. Astrophys., 21, 117 [CrossRef] [Google Scholar]
- Casado, J. 2021b, Astron. Rep., 65, 755 [NASA ADS] [CrossRef] [Google Scholar]
- Chen, Y., Bressan, A., Girardi, L., et al. 2015, MNRAS, 452, 1068 [Google Scholar]
- Conrad, C., Scholz, R. D., Kharchenko, N. V., et al. 2017, A&A, 600, A106 [NASA ADS] [CrossRef] [EDP Sciences] [Google Scholar]
- de La Fuente Marcos, R., & de La Fuente Marcos, C. 2009, A&A, 500, L13 [NASA ADS] [CrossRef] [EDP Sciences] [Google Scholar]
- De Simone, R., Wu, X., & Tremaine, S. 2004, MNRAS, 350, 627 [NASA ADS] [CrossRef] [Google Scholar]
- Dehnen, W. 1998, AJ, 115, 2384 [NASA ADS] [CrossRef] [Google Scholar]
- Dieball, A., Müller, H., & Grebel, E. K. 2002, A&A, 391, 547 [NASA ADS] [CrossRef] [EDP Sciences] [Google Scholar]
- Elmegreen, B. G., & Efremov, Y. N. 1996, ApJ, 466, 802 [NASA ADS] [CrossRef] [Google Scholar]
- Gaia Collaboration (Brown, A. G. A., et al.) 2018, A&A, 616, A1 [NASA ADS] [CrossRef] [EDP Sciences] [Google Scholar]
- Gaia Collaboration (Brown, A. G. A., et al.) 2021, A&A, 649, A1 [NASA ADS] [CrossRef] [EDP Sciences] [Google Scholar]
- Gaia Collaboration (Vallenari, A., et al.) 2023, A&A, 674, A1 [NASA ADS] [CrossRef] [EDP Sciences] [Google Scholar]
- Goodwin, S. P. 1997, MNRAS, 284, 785 [Google Scholar]
- Hunt, E. L., & Reffert, S. 2021, A&A, 646, A104 [NASA ADS] [CrossRef] [EDP Sciences] [Google Scholar]
- Hunt, E. L., & Reffert, S. 2023, A&A, 673, A114 [NASA ADS] [CrossRef] [EDP Sciences] [Google Scholar]
- Hunt, E. L., & Reffert, S. 2024, A&A, 686, A42 [NASA ADS] [CrossRef] [EDP Sciences] [Google Scholar]
- Kounkel, M., Deng, T., & Stassun, K. G. 2022, AJ, 164, 57 [NASA ADS] [CrossRef] [Google Scholar]
- Lada, C. J., & Lada, E. A. 2003, ARA&A, 41, 57 [Google Scholar]
- Li, Z., & Zhu, Z. 2025, A&A, 700, A280 [NASA ADS] [CrossRef] [EDP Sciences] [Google Scholar]
- Liu, L., & Pang, X. 2019, ApJS, 245, 32 [NASA ADS] [CrossRef] [Google Scholar]
- Liu, G., Zhang, Y., Zhong, J., et al. 2025, A&A, 696, A117 [NASA ADS] [CrossRef] [EDP Sciences] [Google Scholar]
- Marigo, P., Girardi, L., Bressan, A., et al. 2017, ApJ, 835, 77 [Google Scholar]
- Messow, B., & Schorr, R. R. E. 1913, Astronomische Abhandlungen der Hamburger Sternwarte, 2, 2 [Google Scholar]
- Palma, T., Coenda, V., Baume, G., & Feinstein, C. 2025, A&A, 693, A218 [NASA ADS] [CrossRef] [EDP Sciences] [Google Scholar]
- Pang, X., Yu, Z., Tang, S.-Y., et al. 2021, ApJ, 923, 20 [NASA ADS] [CrossRef] [Google Scholar]
- Pang, X., Li, Y., Tang, S.-Y., et al. 2022, ApJ, 937, L7 [NASA ADS] [CrossRef] [Google Scholar]
- Pavlovskaya, E. D., & Filippova, A. A. 1989, Soviet Ast., 33, 6 [NASA ADS] [Google Scholar]
- Piecka, M., & Paunzen, E. 2021, A&A, 649, A54 [NASA ADS] [CrossRef] [EDP Sciences] [Google Scholar]
- Piskunov, A. E., Kharchenko, N. V., Röser, S., Schilbach, E., & Scholz, R. D. 2006, A&A, 445, 545 [CrossRef] [EDP Sciences] [Google Scholar]
- Priyatikanto, R., Ikbal Arifyanto, M., Wulandari, H. R. T., & Siregar, S. 2019, J. Phys. Conf. Ser., 1127, 012053 [NASA ADS] [CrossRef] [Google Scholar]
- Qin, S., Zhong, J., Tang, T., & Chen, L. 2023, ApJS, 265, 12 [NASA ADS] [CrossRef] [Google Scholar]
- Qin, S., Zhong, J., Tang, T., et al. 2025, A&A, 693, A317 [NASA ADS] [CrossRef] [EDP Sciences] [Google Scholar]
- Song, F., Esamdin, A., Hu, Q., & Zhang, M. 2022, A&A, 666, A75 [NASA ADS] [CrossRef] [EDP Sciences] [Google Scholar]
- Soubiran, C., Cantat-Gaudin, T., Romero-Gómez, M., et al. 2019, A&A, 623, C2 [EDP Sciences] [Google Scholar]
- Subramaniam, A., Gorti, U., Sagar, R., & Bhatt, H. C. 1995, A&A, 302, 86 [NASA ADS] [Google Scholar]
- Tian, H.-J. 2020, ApJ, 904, 196 [NASA ADS] [CrossRef] [Google Scholar]
- van den Bergh, S. 1996, ApJ, 471, L31 [Google Scholar]
- Zhong, J., Chen, L., Kouwenhoven, M. B. N., et al. 2019, A&A, 624, A34 [NASA ADS] [CrossRef] [EDP Sciences] [Google Scholar]
All Tables
All Figures
|
Fig. 1 Comparison of the distributions for the spatial separation and velocity difference of the nearest neighbors. The pink histogram is the result of one mock trial, while the blue histograms correspond to the results from our working sample. |
| In the text | |
|
Fig. 2 Distribution of peak values of spatial separation and velocity difference for nearest neighbors in 1000 mock trials. |
| In the text | |
|
Fig. 3 Distribution of different types of cluster pairs and sample category. The blue bars represent the total number of pairs in each type of cluster pair, the orange bars indicate those in the full sample, and the red bars correspond to the golden sample. The numbers above each bar indicate the total number of pairs in that subcategory. Cluster pair types include primordial binary clusters (PBCs), tidal capture or resonant trapping binary clusters (TBCs), and hyperbolic encounter pairs (HEPs), as defined in Section 4.2. |
| In the text | |
|
Fig. 4 Multi-dimensional distributions of representative cluster pairs of different types. Shown are the distributions of member stars in spatial coordinates (left panel), radial velocity (middle panel), and color–magnitude diagram (CMD; right panel). Each point is colored according to the OC to which the star belongs. Arrows indicate the tangential velocities of the clusters; each cluster pair is plotted using a distinct velocity scale for clarity. |
| In the text | |
|
Fig. 5 Mass ratio vs. spatial separation for pairs with ΔD3D ≤ 50. The gray symbols represent pairs from the initial sample, while the blue symbols represent cluster pairs identified in this work. Circles indicate pairs with TF values lower than 200, and triangles indicate those with TF values greater than 200. |
| In the text | |
|
Fig. 6 Cross-matching results with previous studies. Distribution of BC candidates by classification type (PBC, TBC, HEP) showing the number of systems that are new (blue) vs. those previously reported in the literature (filled). |
| In the text | |
|
Fig. 7 Spatial separation as a function of tangential velocity for all matched cluster pairs from the literature. Circles denote BC candidates confirmed in this work, while triangles represent discarded pairs. The red symbols represent pairs with ΔV3D ≤ 20 km s−1, and green symbols indicate those with ΔV3D > 20 km s−1. The shaded region marks the selection range adopted for our BC sample. |
| In the text | |
|
Fig. 8 Pie chart showing the number of star clusters in each group (see inset for color-coding by number of group members). |
| In the text | |
Current usage metrics show cumulative count of Article Views (full-text article views including HTML views, PDF and ePub downloads, according to the available data) and Abstracts Views on Vision4Press platform.
Data correspond to usage on the plateform after 2015. The current usage metrics is available 48-96 hours after online publication and is updated daily on week days.
Initial download of the metrics may take a while.