Open Access
Fig. 5
Download original image
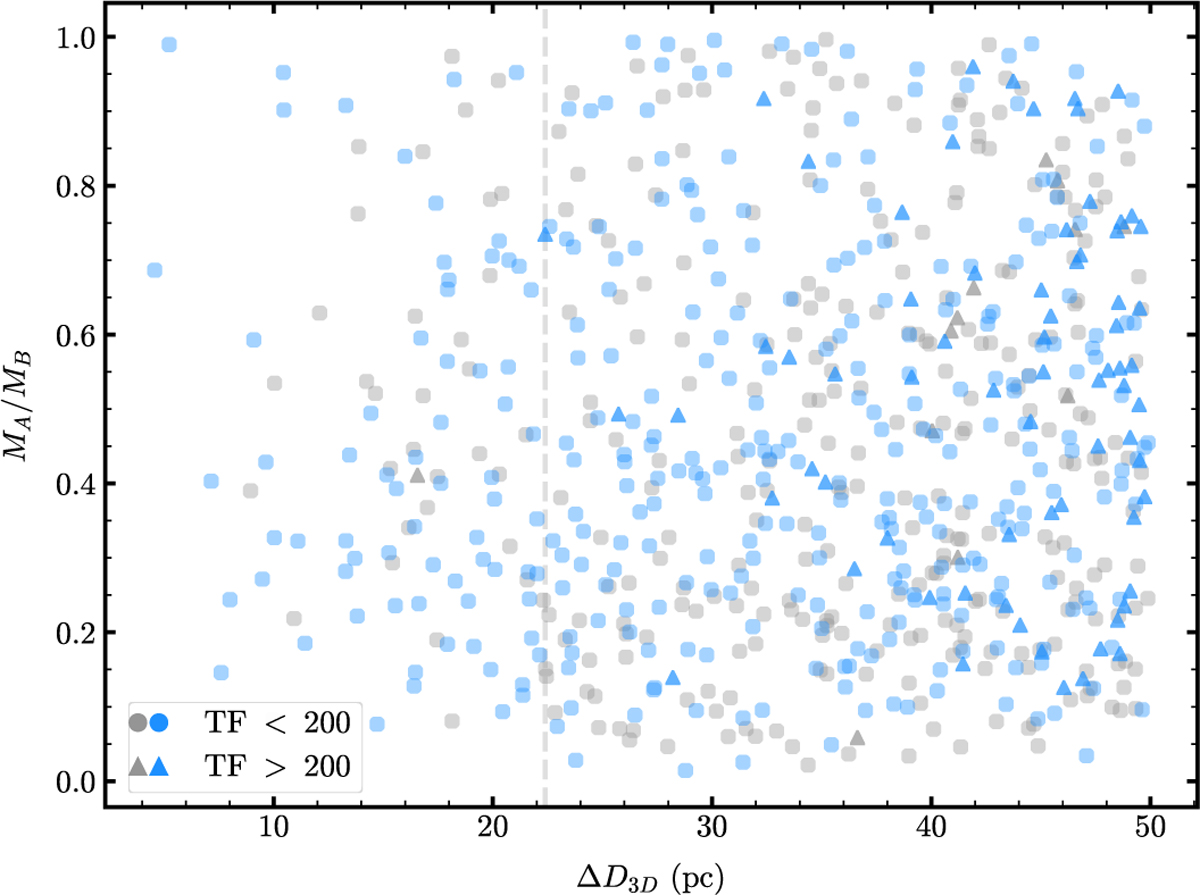
Mass ratio vs. spatial separation for pairs with ΔD3D ≤ 50. The gray symbols represent pairs from the initial sample, while the blue symbols represent cluster pairs identified in this work. Circles indicate pairs with TF values lower than 200, and triangles indicate those with TF values greater than 200.
Current usage metrics show cumulative count of Article Views (full-text article views including HTML views, PDF and ePub downloads, according to the available data) and Abstracts Views on Vision4Press platform.
Data correspond to usage on the plateform after 2015. The current usage metrics is available 48-96 hours after online publication and is updated daily on week days.
Initial download of the metrics may take a while.