Fig. 7
Download original image
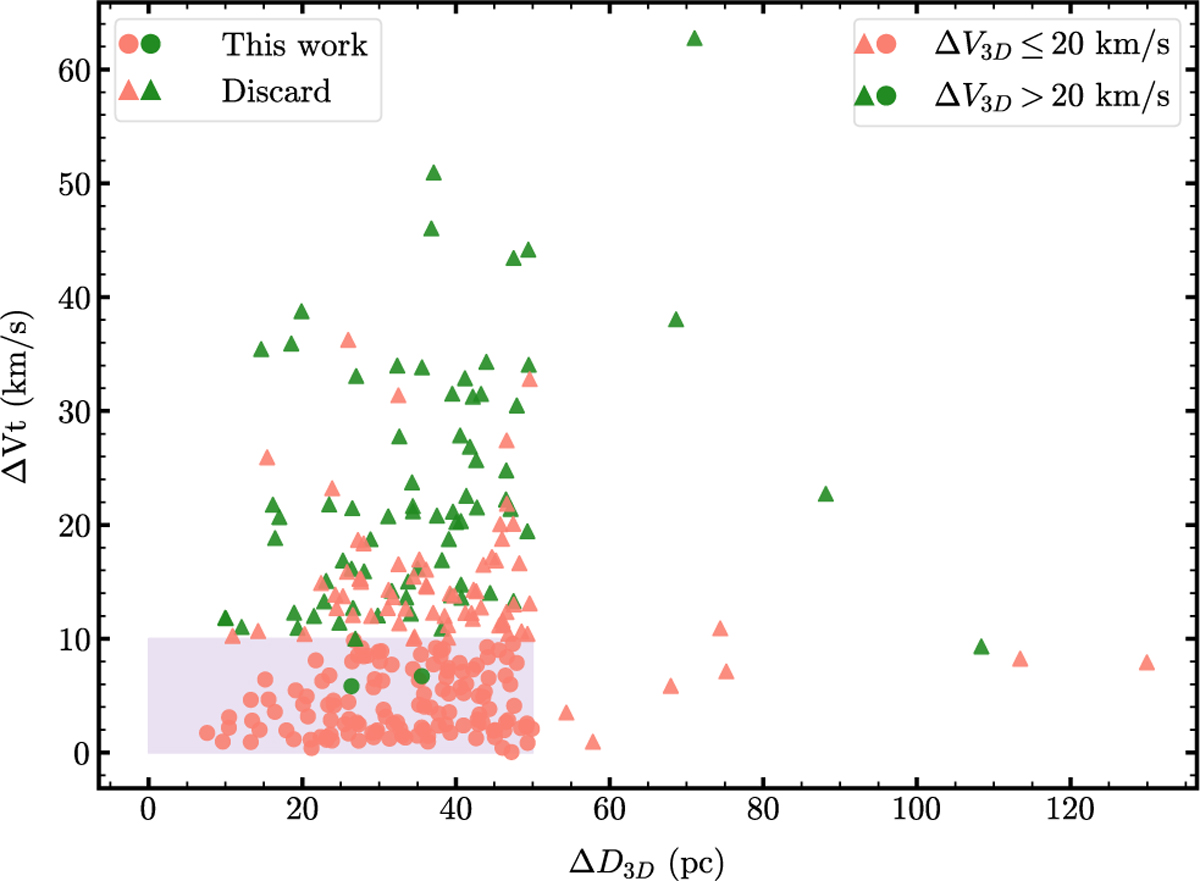
Spatial separation as a function of tangential velocity for all matched cluster pairs from the literature. Circles denote BC candidates confirmed in this work, while triangles represent discarded pairs. The red symbols represent pairs with ΔV3D ≤ 20 km s−1, and green symbols indicate those with ΔV3D > 20 km s−1. The shaded region marks the selection range adopted for our BC sample.
Current usage metrics show cumulative count of Article Views (full-text article views including HTML views, PDF and ePub downloads, according to the available data) and Abstracts Views on Vision4Press platform.
Data correspond to usage on the plateform after 2015. The current usage metrics is available 48-96 hours after online publication and is updated daily on week days.
Initial download of the metrics may take a while.