Fig. 1
Download original image
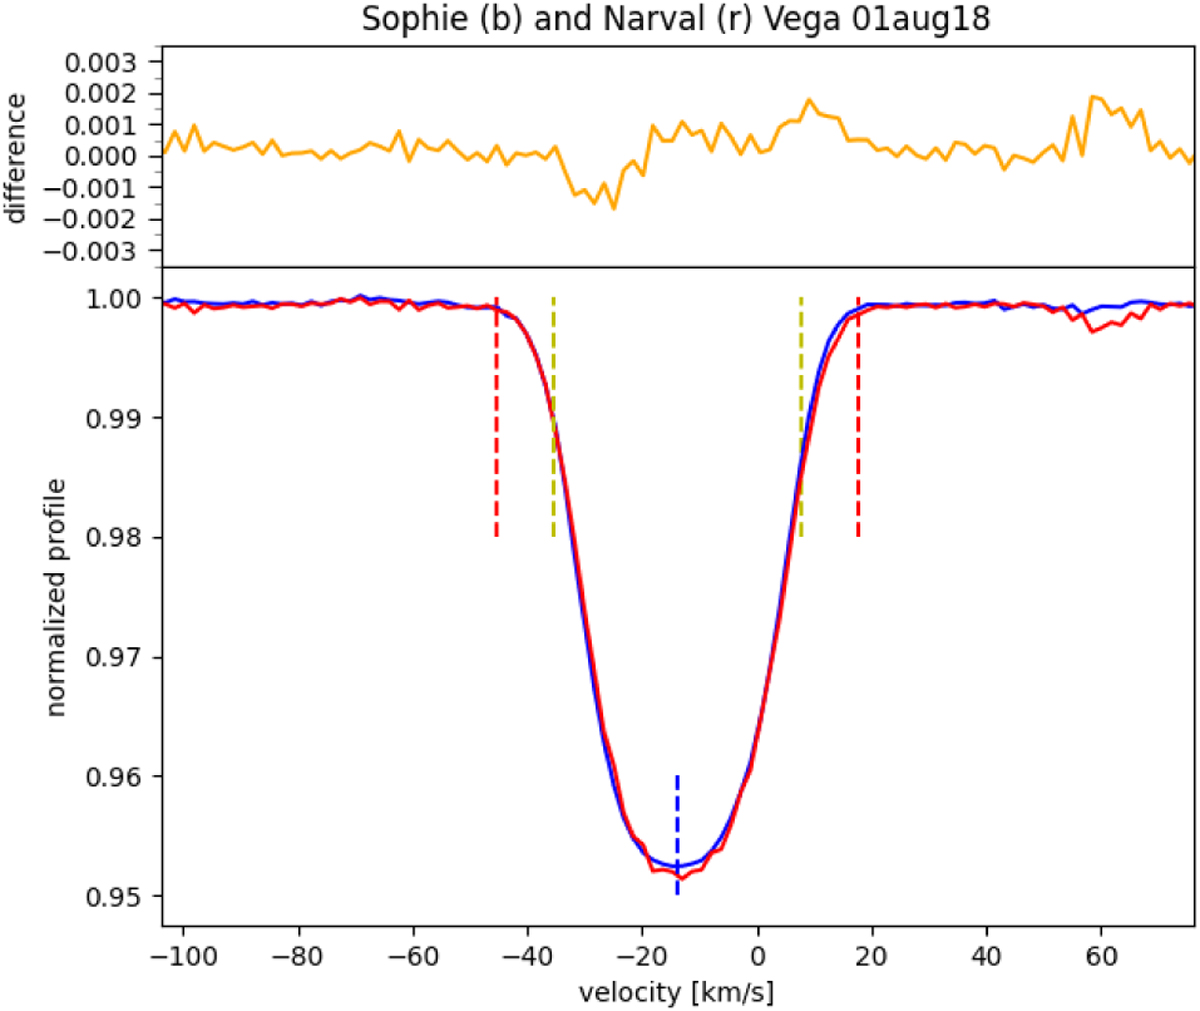
Comparison of the LSD Stokes I intensity profile of Vega obtained with NARVAL/TBL and the new NEXTRA pipeline (red) and a quasi-simultaneous observation with SOPHIE/OHP (within one minute, blue), both processed with LSDpy. Stokes I profiles are quasi-identical. The difference of the SOPHIE and NARVAL profile is presented in the top panel (orange). Dashed blue line corresponds to the radial velocity of Vega of −13.9 km s−1. The dashed yellow lines show ±v sin i (21.6 km s−1), while the dashed red lines correspond to the outer limits of the profile including gaussian broadening (at additional ±10 km s−1). Data come from 1 August 2018 at 23:11 UT.
Current usage metrics show cumulative count of Article Views (full-text article views including HTML views, PDF and ePub downloads, according to the available data) and Abstracts Views on Vision4Press platform.
Data correspond to usage on the plateform after 2015. The current usage metrics is available 48-96 hours after online publication and is updated daily on week days.
Initial download of the metrics may take a while.