Fig. 3
Download original image
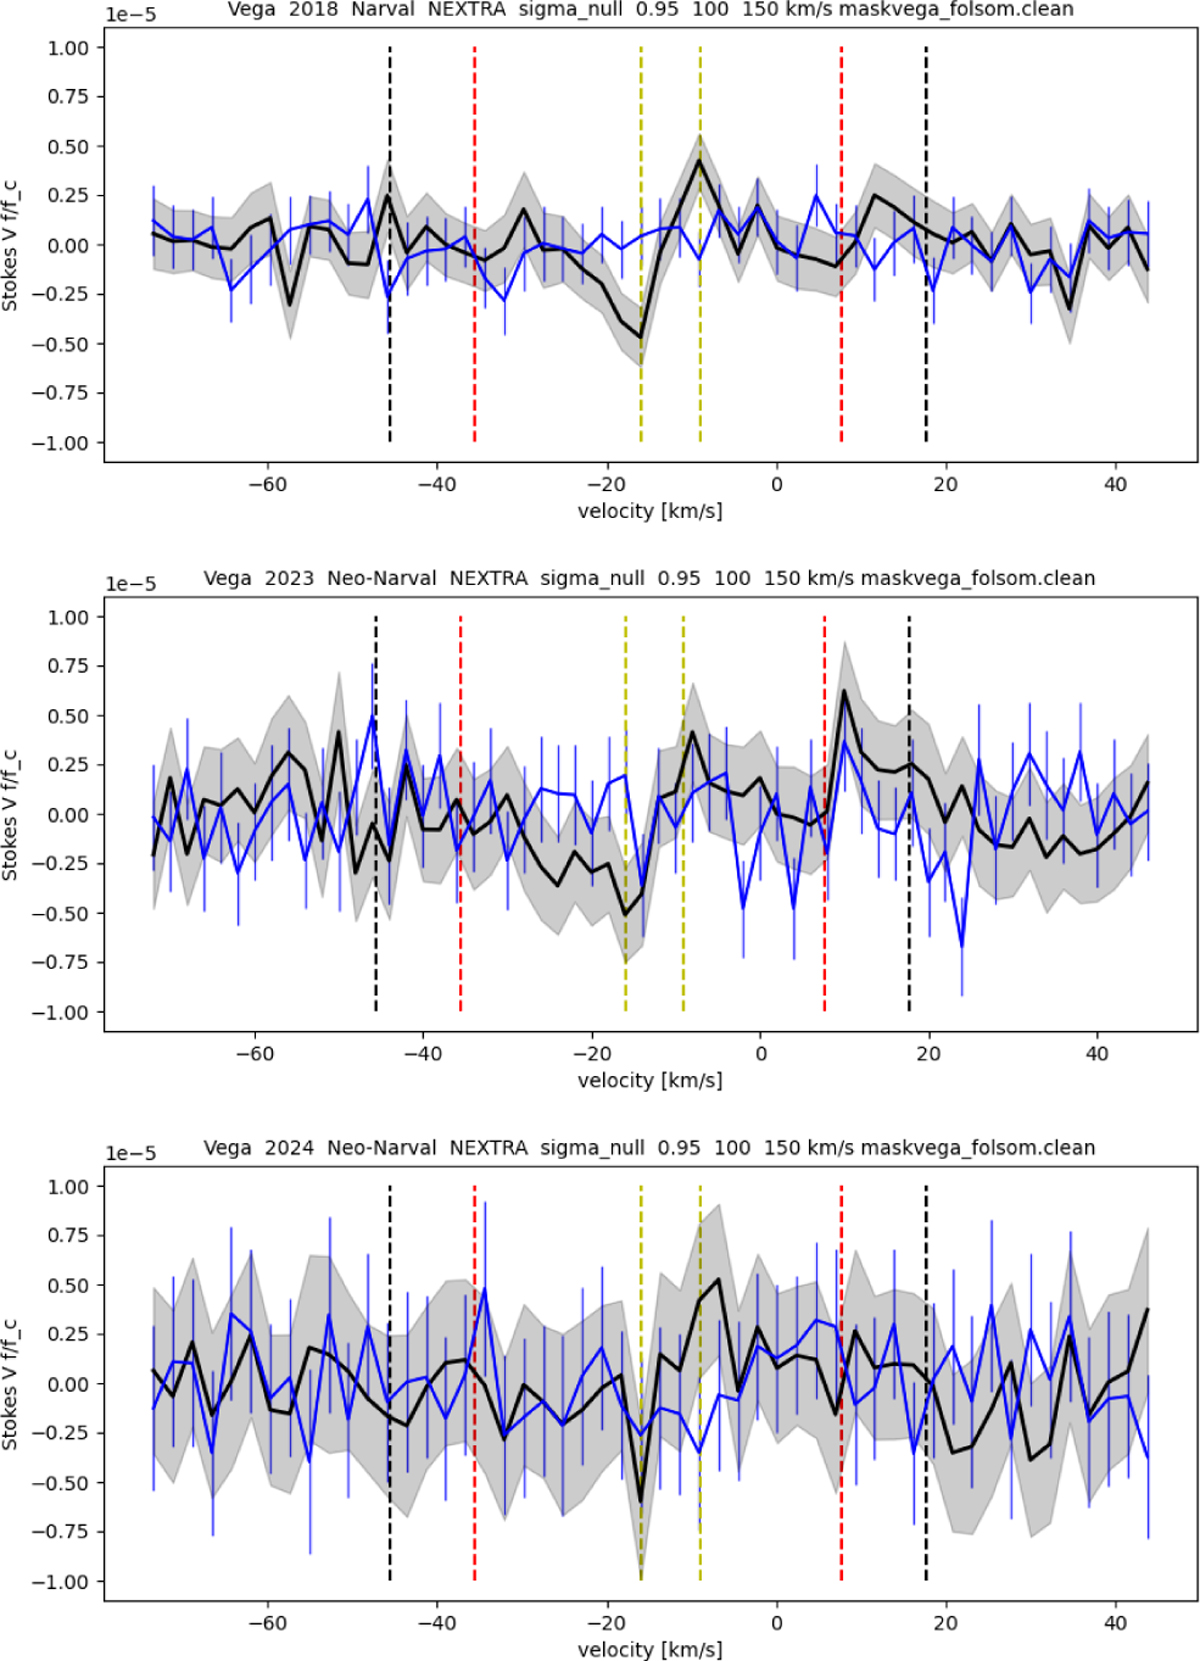
Average Stokes V profile of Vega: 2018 (top), august 2023 (middle), and 2024 (bottom). Black line and grey zone: Averaged Stokes V and ±1 σ envelope. Blue line and 1 σ error bars: Averaged Null profile. Vertical dashed yellow lines show the position of the negative and positive peak of the 2018 averaged Stokes V profile. The dashed red lines show ±v sin i, while the dashed black lines correspond to the outer limits of the profile including gaussian broadening (additional ±10 km s−1) as shown in Fig. 1.
Current usage metrics show cumulative count of Article Views (full-text article views including HTML views, PDF and ePub downloads, according to the available data) and Abstracts Views on Vision4Press platform.
Data correspond to usage on the plateform after 2015. The current usage metrics is available 48-96 hours after online publication and is updated daily on week days.
Initial download of the metrics may take a while.