Fig. 8
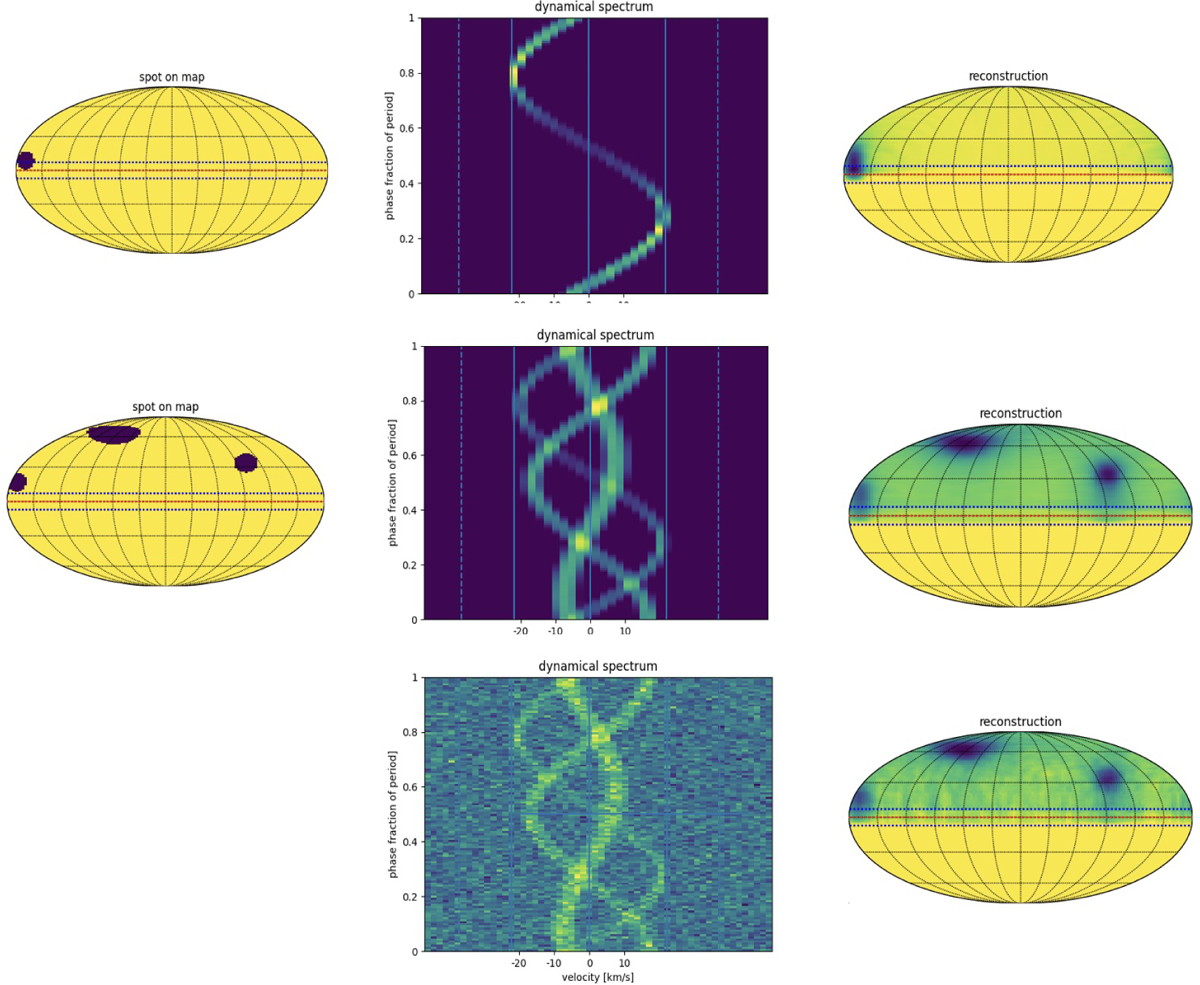
Download original image
Simulation of a spotted stellar surface in Mollweide projection and seen almost pole on as Vega. Deep blue are dark spots which appear in emission in the dynamical spectrum. Phase 0 is at the left of the stellar map (rotation vector points towards the top). Stellar rotation is counterclockwise in this representation. A spot at the central meridian of the stellar sphere (in front of the observer) would have phase zero and appear on the left of the map. Phases increase clockwise on the stellar sphere. If we read the map in analogy to the terrestrial coordinates, then the phase would correspond to the negative longitude. Left: original map of the stellar surface. Middle: dynamical spectrum. Right: reconstructed stellar surface map. Top: single spot. Middle: complex pattern of three spots of different sizes. Bottom: simulation of a realistic dynamical spectrum (signatures with an amplitude of 1.5 × 10⁻⁴ F/Fc and a noise of σ = 5 × 10⁵−5).
Current usage metrics show cumulative count of Article Views (full-text article views including HTML views, PDF and ePub downloads, according to the available data) and Abstracts Views on Vision4Press platform.
Data correspond to usage on the plateform after 2015. The current usage metrics is available 48-96 hours after online publication and is updated daily on week days.
Initial download of the metrics may take a while.