Fig. 9
Download original image
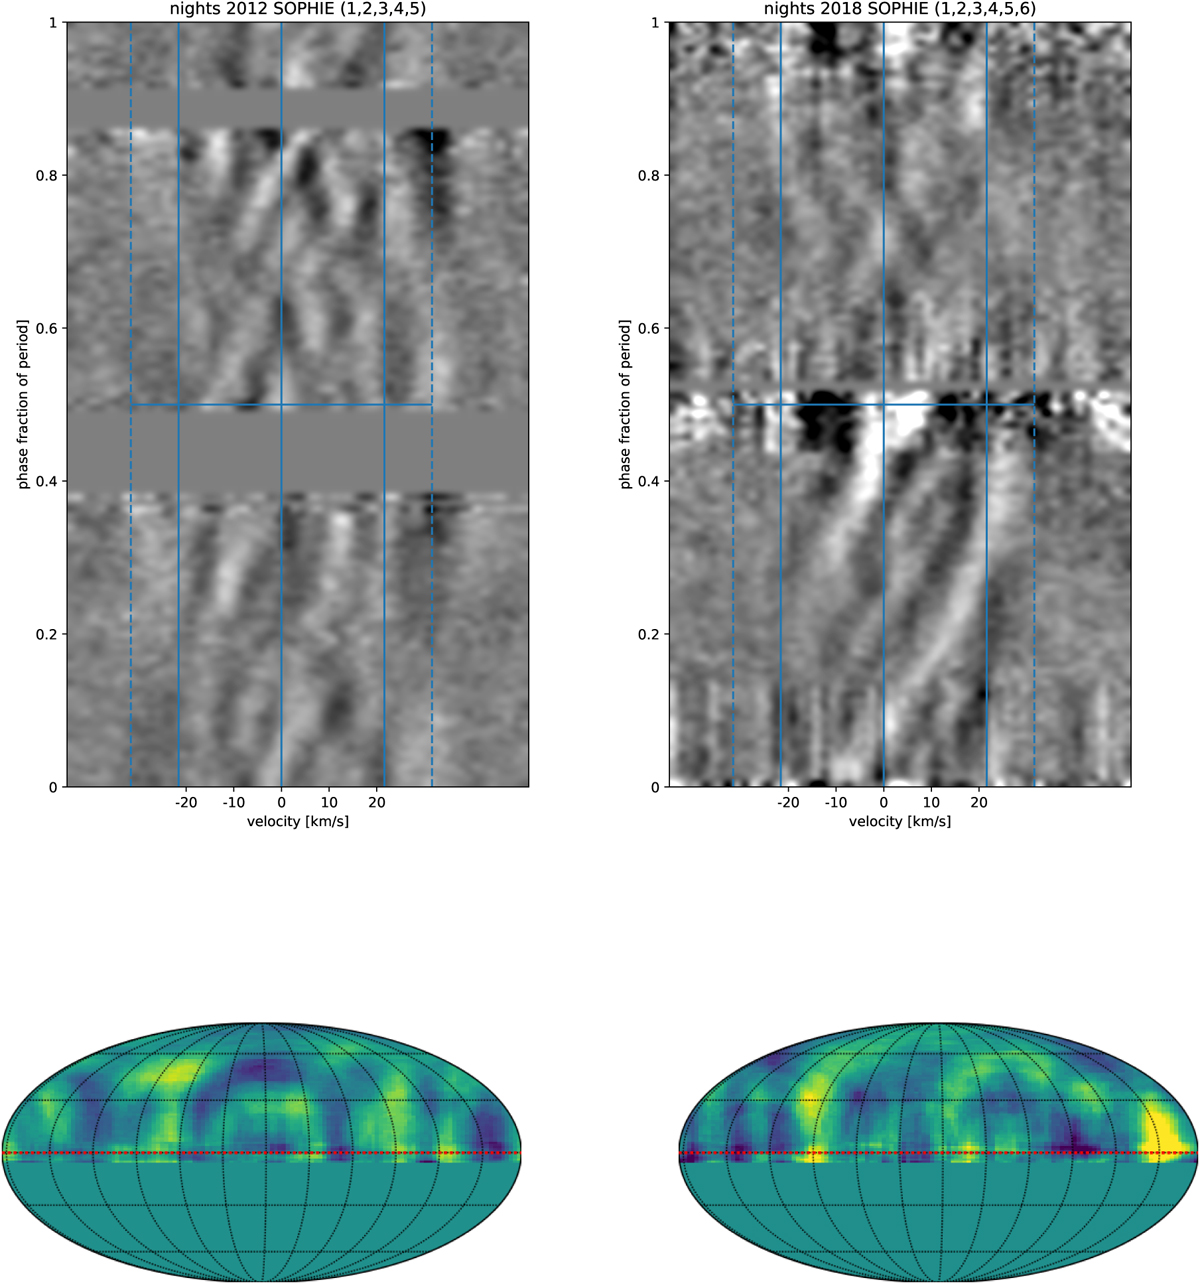
Vega observations with SOPHIE/OHP in 2012 and 2018. Upper panels: dynamical spectra of 2012 and 2018. Phase zero corresponds for the 2018 dataset to BJD = 2456892.015. For the 2012 dataset, we opted for BJD = 2456142.332. The two inner blue lines symmetric to zero velocity correspond to ± v sin i = 21.6 km s−1, while the outer dashed blue lines include the zone where Gaussian broadening widens the line profile. Lower panels: reconstructed surface map of Vega in Mollweide projection, based on the procedure described in Sect. 4.2. Left: map of 2012. Right: map of 2018. Overall, 80% of the highest S/N files were kept for map building.
Current usage metrics show cumulative count of Article Views (full-text article views including HTML views, PDF and ePub downloads, according to the available data) and Abstracts Views on Vision4Press platform.
Data correspond to usage on the plateform after 2015. The current usage metrics is available 48-96 hours after online publication and is updated daily on week days.
Initial download of the metrics may take a while.