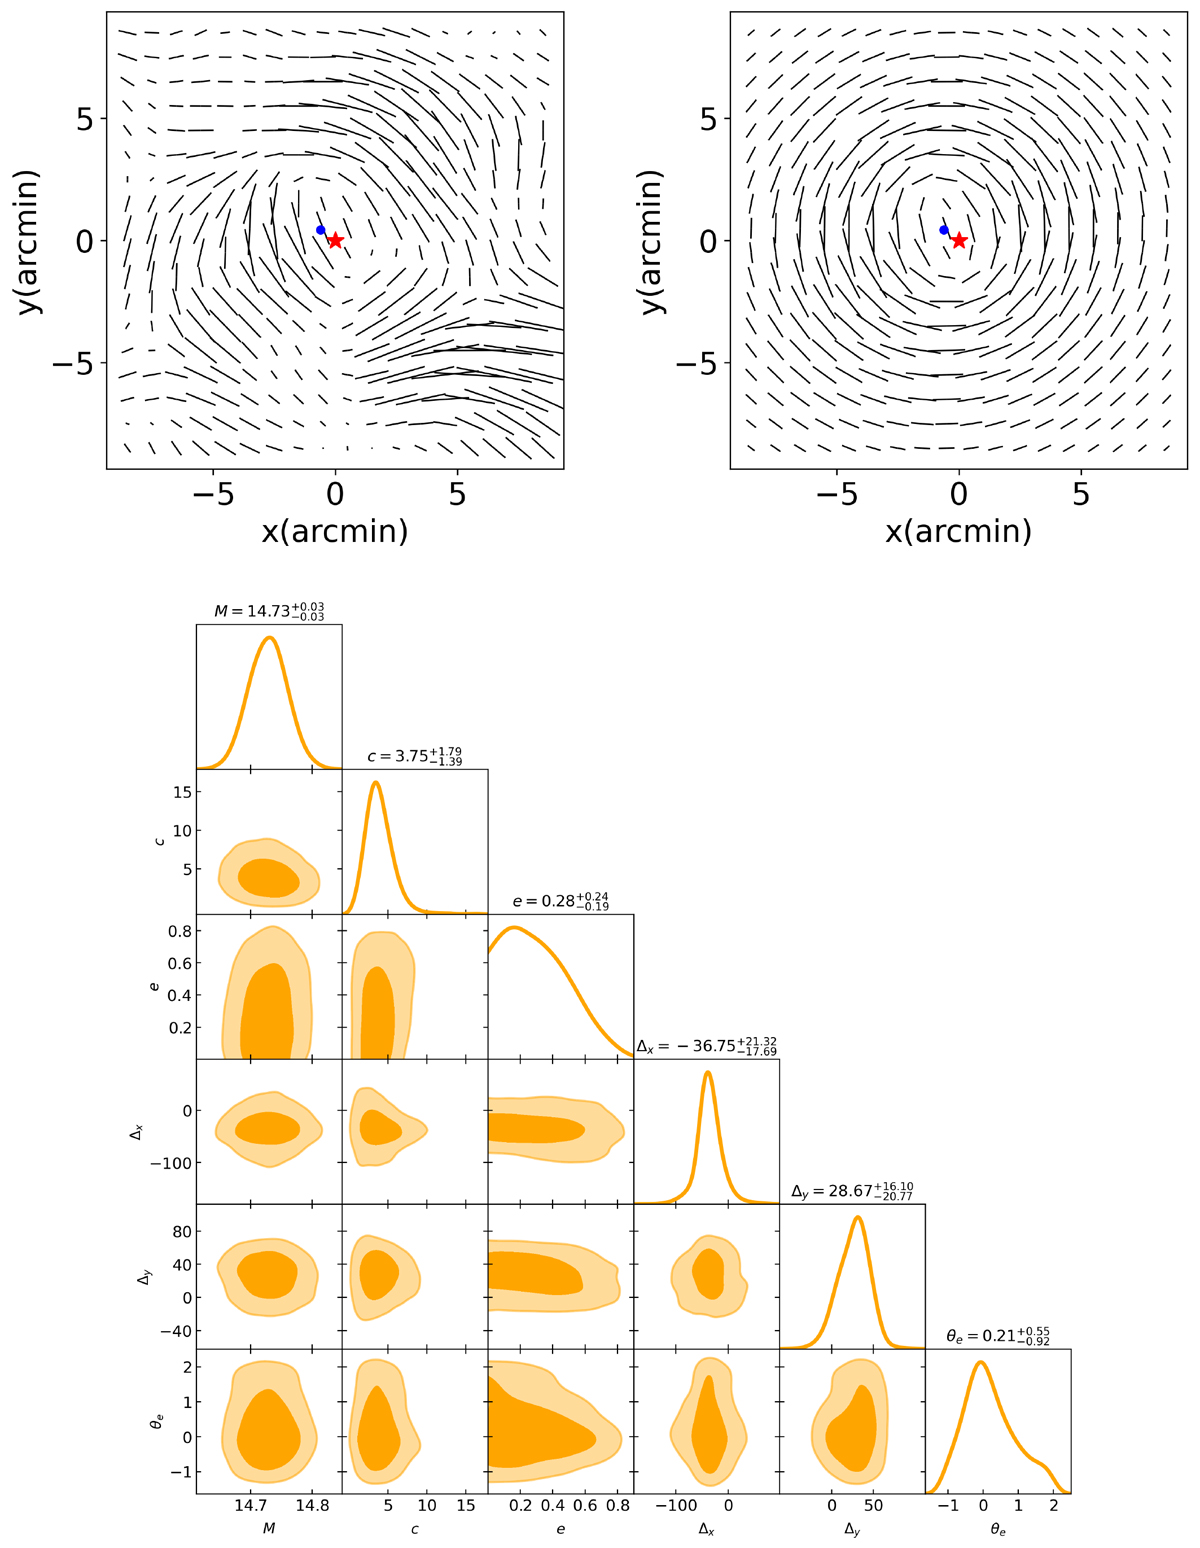
Fig. 2.
Download original image
Upper panels: The left panel shows the observed 2D shear map for an illustrative redMaPPer cluster (M ≃ 1014.73 h−1 M⊙), while the right panel displays the corresponding best-fitting shear field predicted by the elliptical NFW model. Each map covers an area of 18′×18′. In both maps, the orientation and length of the sticks within each 1′×′ pixel indicate the local tangential direction and amplitude of the distortion, respectively. For visualization purposes, both shear fields have been smoothed with a Gaussian kernel with a full width at half maximum (FWHM) of ≈2′ (Oguri et al. 2010). The blue dot marks the weak-lensing-derived center, and the red pentagram denotes the observed center. Lower panel: Posterior constraints on structural parameters of the cluster, including the halo concentration, ellipticity, and projected offsets of the mass centroid. The contours represent the 1σ and 2σ confidence levels.
Current usage metrics show cumulative count of Article Views (full-text article views including HTML views, PDF and ePub downloads, according to the available data) and Abstracts Views on Vision4Press platform.
Data correspond to usage on the plateform after 2015. The current usage metrics is available 48-96 hours after online publication and is updated daily on week days.
Initial download of the metrics may take a while.