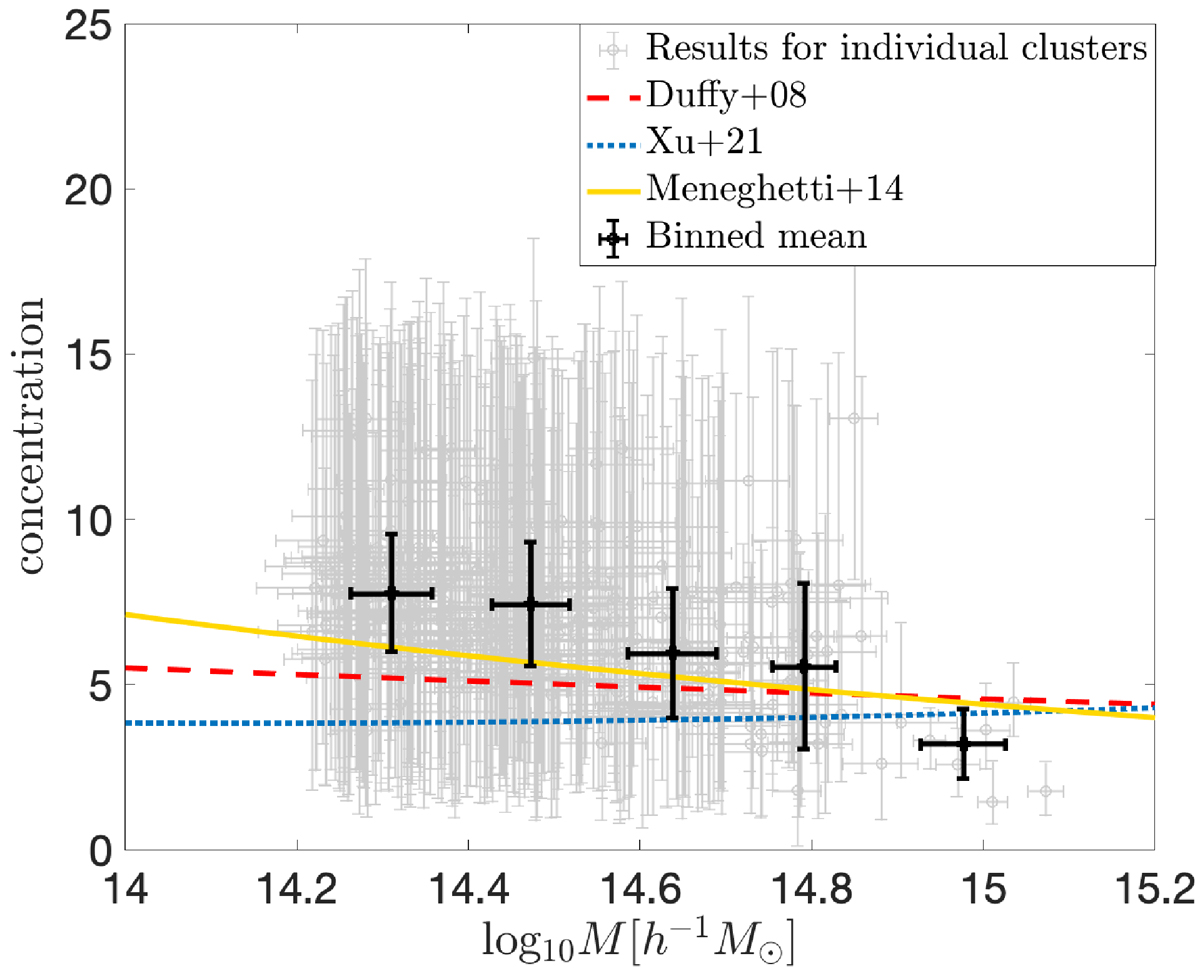
Fig. 3.
Download original image
Concentration–mass (c–M) relation. Light gray points represent the best-fitting concentration and mass for individual clusters, while black points show the weighted average values in each mass bin, with error bars indicating the standard deviation. For comparison, the results for strong-lensing selected halos from Meneghetti et al. (2014) are shown by a solid orange line. Weak-lensing-based results from Xu et al. (2021) (upturn model) are plotted as a dashed-dotted blue line, and the power-law model from Duffy et al. (2008) derived from DM-only numerical simulations, is plotted as a dashed red line, respectively.
Current usage metrics show cumulative count of Article Views (full-text article views including HTML views, PDF and ePub downloads, according to the available data) and Abstracts Views on Vision4Press platform.
Data correspond to usage on the plateform after 2015. The current usage metrics is available 48-96 hours after online publication and is updated daily on week days.
Initial download of the metrics may take a while.