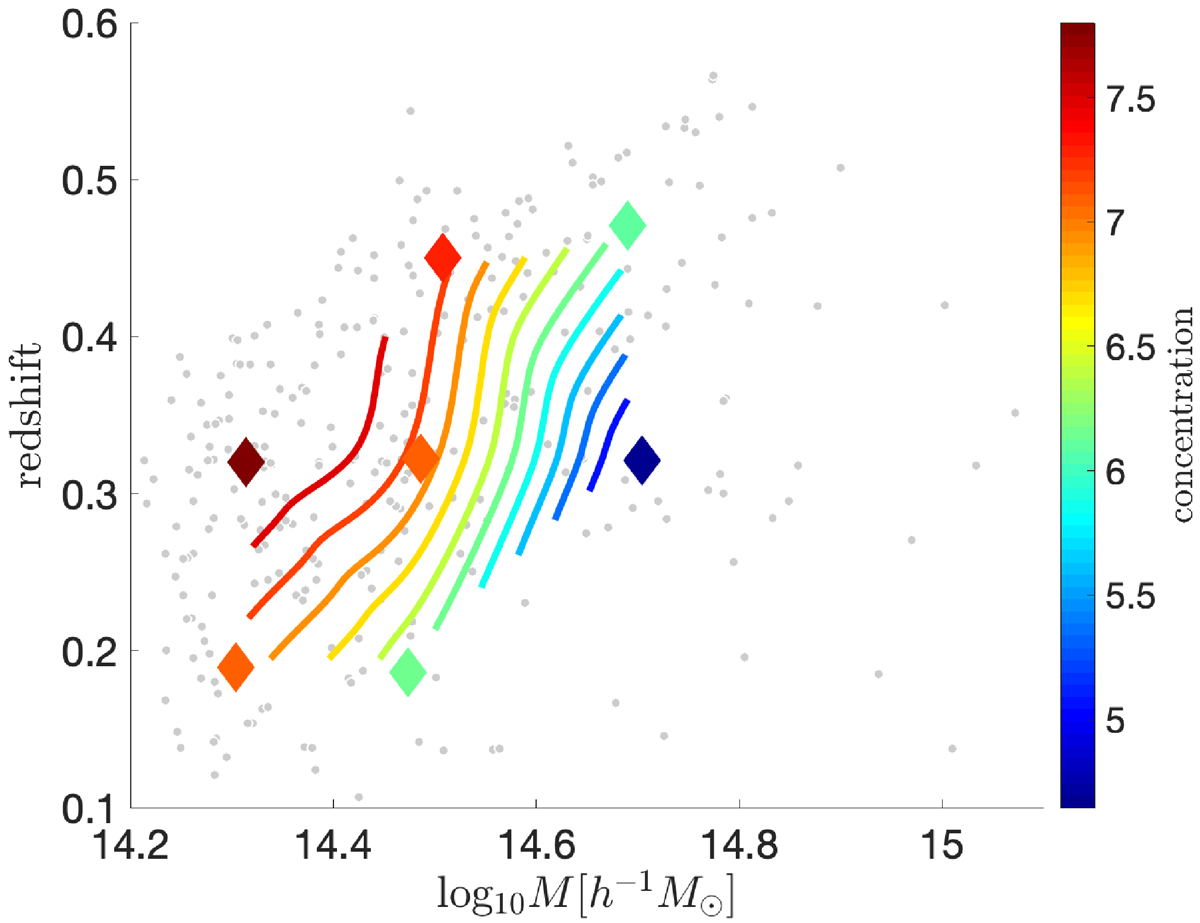
Fig. 4.
Download original image
Concentration–mass–redshift (c–M–z) relation. Gray points indicate the positions of individual clusters in the mass–redshift plane. Colored diamonds represent the weighted mean concentration within each bin. Bins containing fewer than ten clusters are excluded from the analysis. Colored contour lines trace surfaces of constant concentration across the plane, and the color bar (labeled “concentration”) gives their numerical values.
Current usage metrics show cumulative count of Article Views (full-text article views including HTML views, PDF and ePub downloads, according to the available data) and Abstracts Views on Vision4Press platform.
Data correspond to usage on the plateform after 2015. The current usage metrics is available 48-96 hours after online publication and is updated daily on week days.
Initial download of the metrics may take a while.