Fig. 5.
Download original image
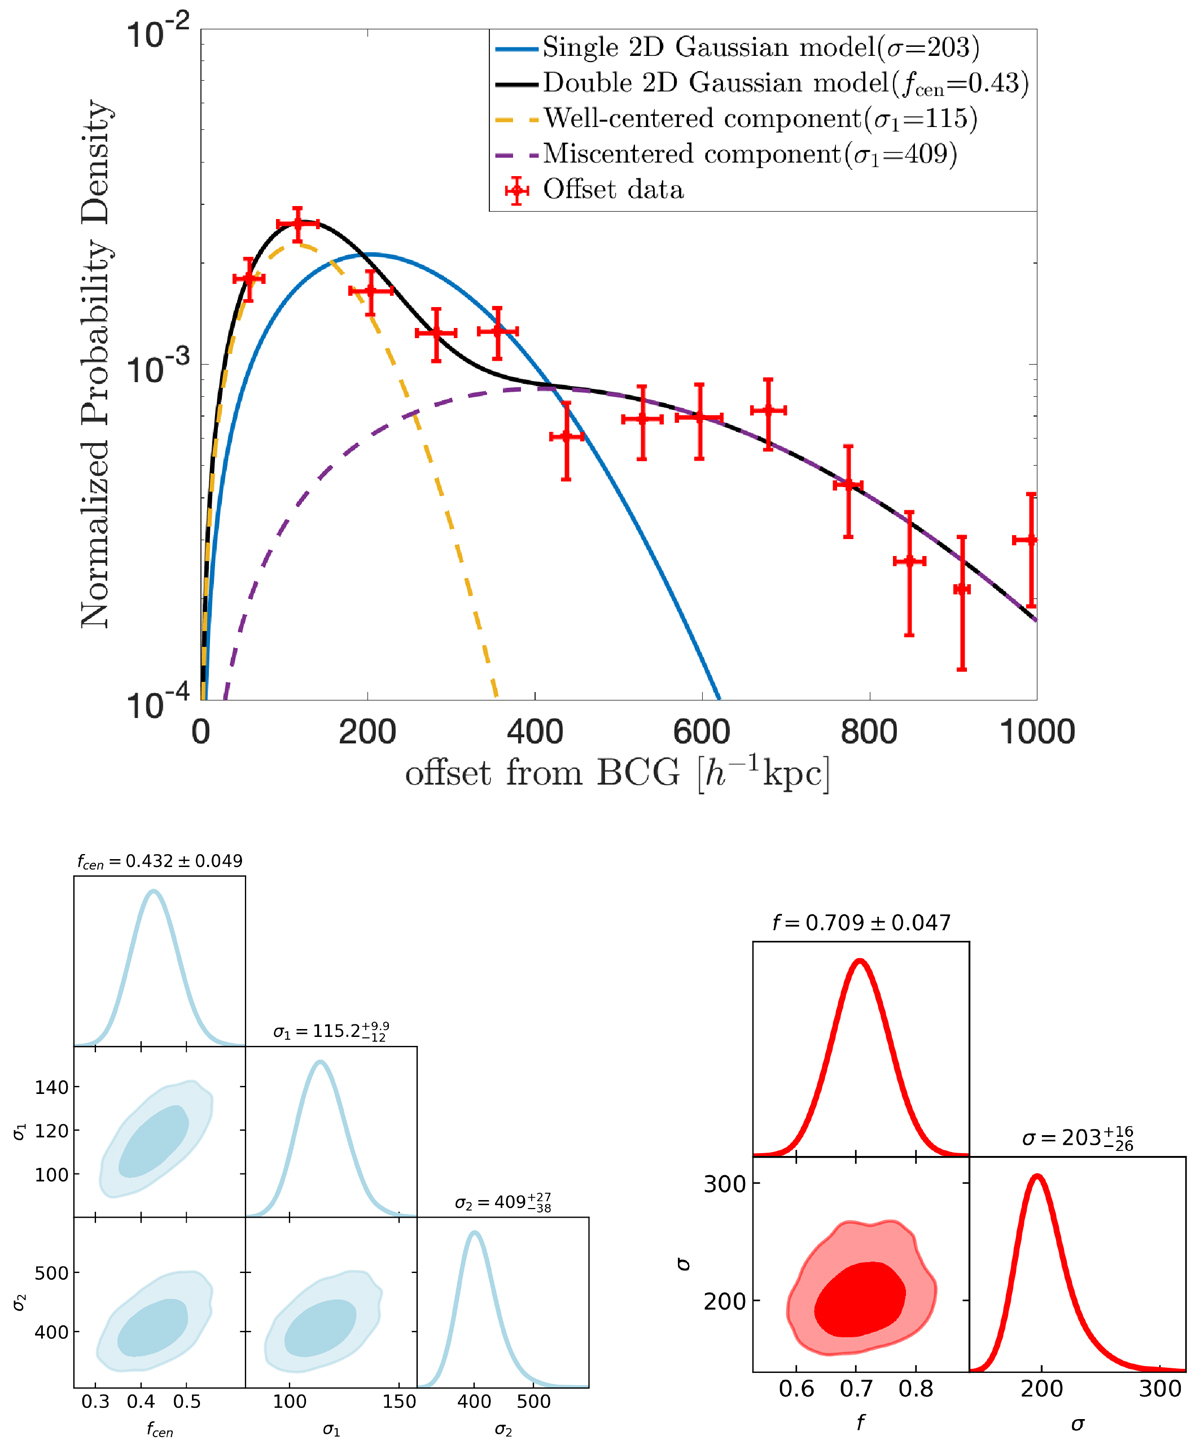
Upper panel: Probability distribution function (PDF) of the projected offset between the BCG position and the weak-lensing-determined halo center. Red data points show the observed BCG offsets in our sample, with error bars estimated via 1000 bootstrap resamplings. The solid blue and black lines represent the best-fitting single- and two-component 2D Gaussian models, respectively. The dashed purple and orange lines correspond to the well-centered and miscentered components of the two-component model. All offset scale parameters, including σ, σ1, and σ2, are expressed in units of h−1 kpc. Lower panels: Fitting results for the two-component (left) and single-component (right) 2D Gaussian models. Contours indicate 1σ and 2σ confidence levels, with best-fitting values and 68% confidence intervals shown above each 1D marginalized distribution.
Current usage metrics show cumulative count of Article Views (full-text article views including HTML views, PDF and ePub downloads, according to the available data) and Abstracts Views on Vision4Press platform.
Data correspond to usage on the plateform after 2015. The current usage metrics is available 48-96 hours after online publication and is updated daily on week days.
Initial download of the metrics may take a while.