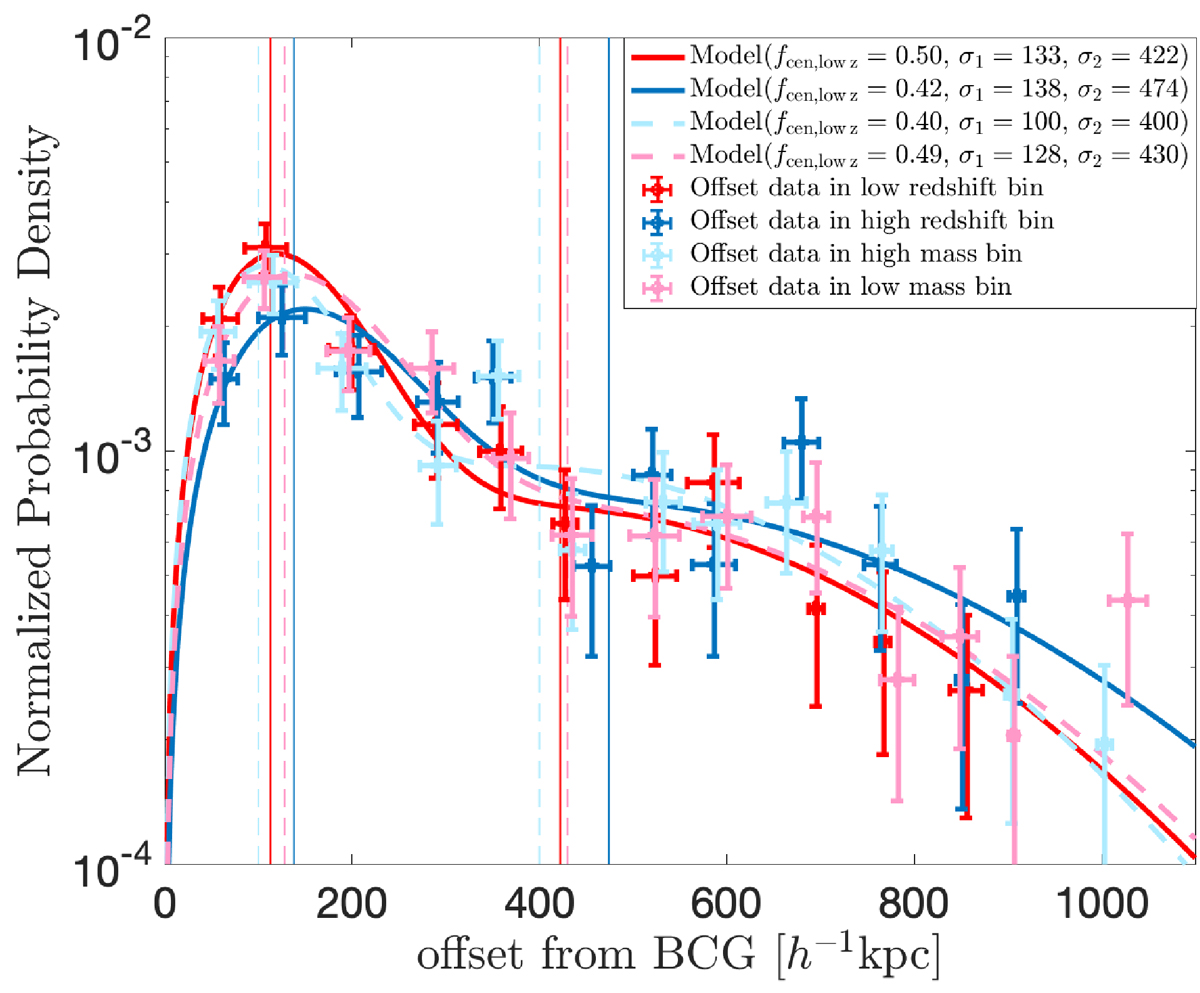
Fig. 6.
Download original image
Probability distribution functions (PDFs) of the projected offsets between the BCG and the weak-lensing-determined halo center for different redshift and mass bins. All error bars are estimated from 1000 bootstrap resamplings. Red and blue points represent the low- and high-redshift subsamples, respectively, with solid lines showing the best-fitting two-component 2D Gaussian models. Corresponding vertical lines indicate the values of σ1 and σ2. Pink and light blue points show the low- and high-mass subsamples, respectively, with dashed lines and vertical markers indicating the best fits and offset scales.
Current usage metrics show cumulative count of Article Views (full-text article views including HTML views, PDF and ePub downloads, according to the available data) and Abstracts Views on Vision4Press platform.
Data correspond to usage on the plateform after 2015. The current usage metrics is available 48-96 hours after online publication and is updated daily on week days.
Initial download of the metrics may take a while.