Fig. 7.
Download original image
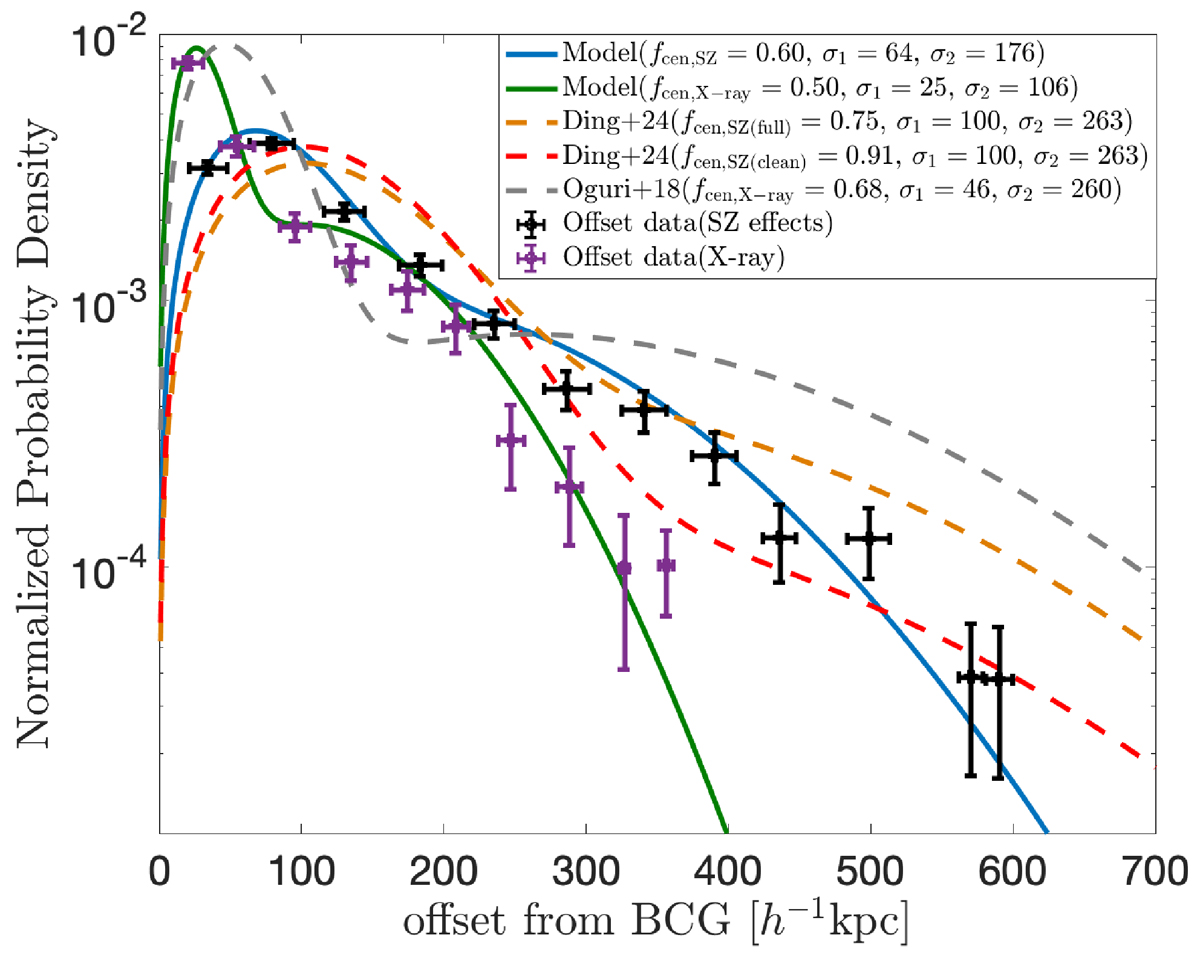
Probability distribution functions (PDFs) of the projected offsets between the BCG position and the SZ- or X-ray-determined cluster centers. Black and purple data points represent the offsets between the redMaPPer optical centers and the SZ (ACT DR5) or X-ray cluster centers, respectively. The solid blue and green lines show the best-fitting two-component 2D Gaussian models for the SZ and X-ray cases. The dashed orange and red lines show results from Ding et al. (2025): the orange line corresponds to all 186 optical–SZ cross-matched clusters, while the red line excludes clusters affected by astrophysical effects (e.g., ongoing mergers) or systematic biases in the HSC data and cluster-finding algorithm. The dashed gray line shows the X-ray–optical offset distribution from Oguri et al. (2018), based on HSC Wide S16A clusters. All offsets are shown in physical units of h−1 kpc.
Current usage metrics show cumulative count of Article Views (full-text article views including HTML views, PDF and ePub downloads, according to the available data) and Abstracts Views on Vision4Press platform.
Data correspond to usage on the plateform after 2015. The current usage metrics is available 48-96 hours after online publication and is updated daily on week days.
Initial download of the metrics may take a while.