Fig. 8.
Download original image
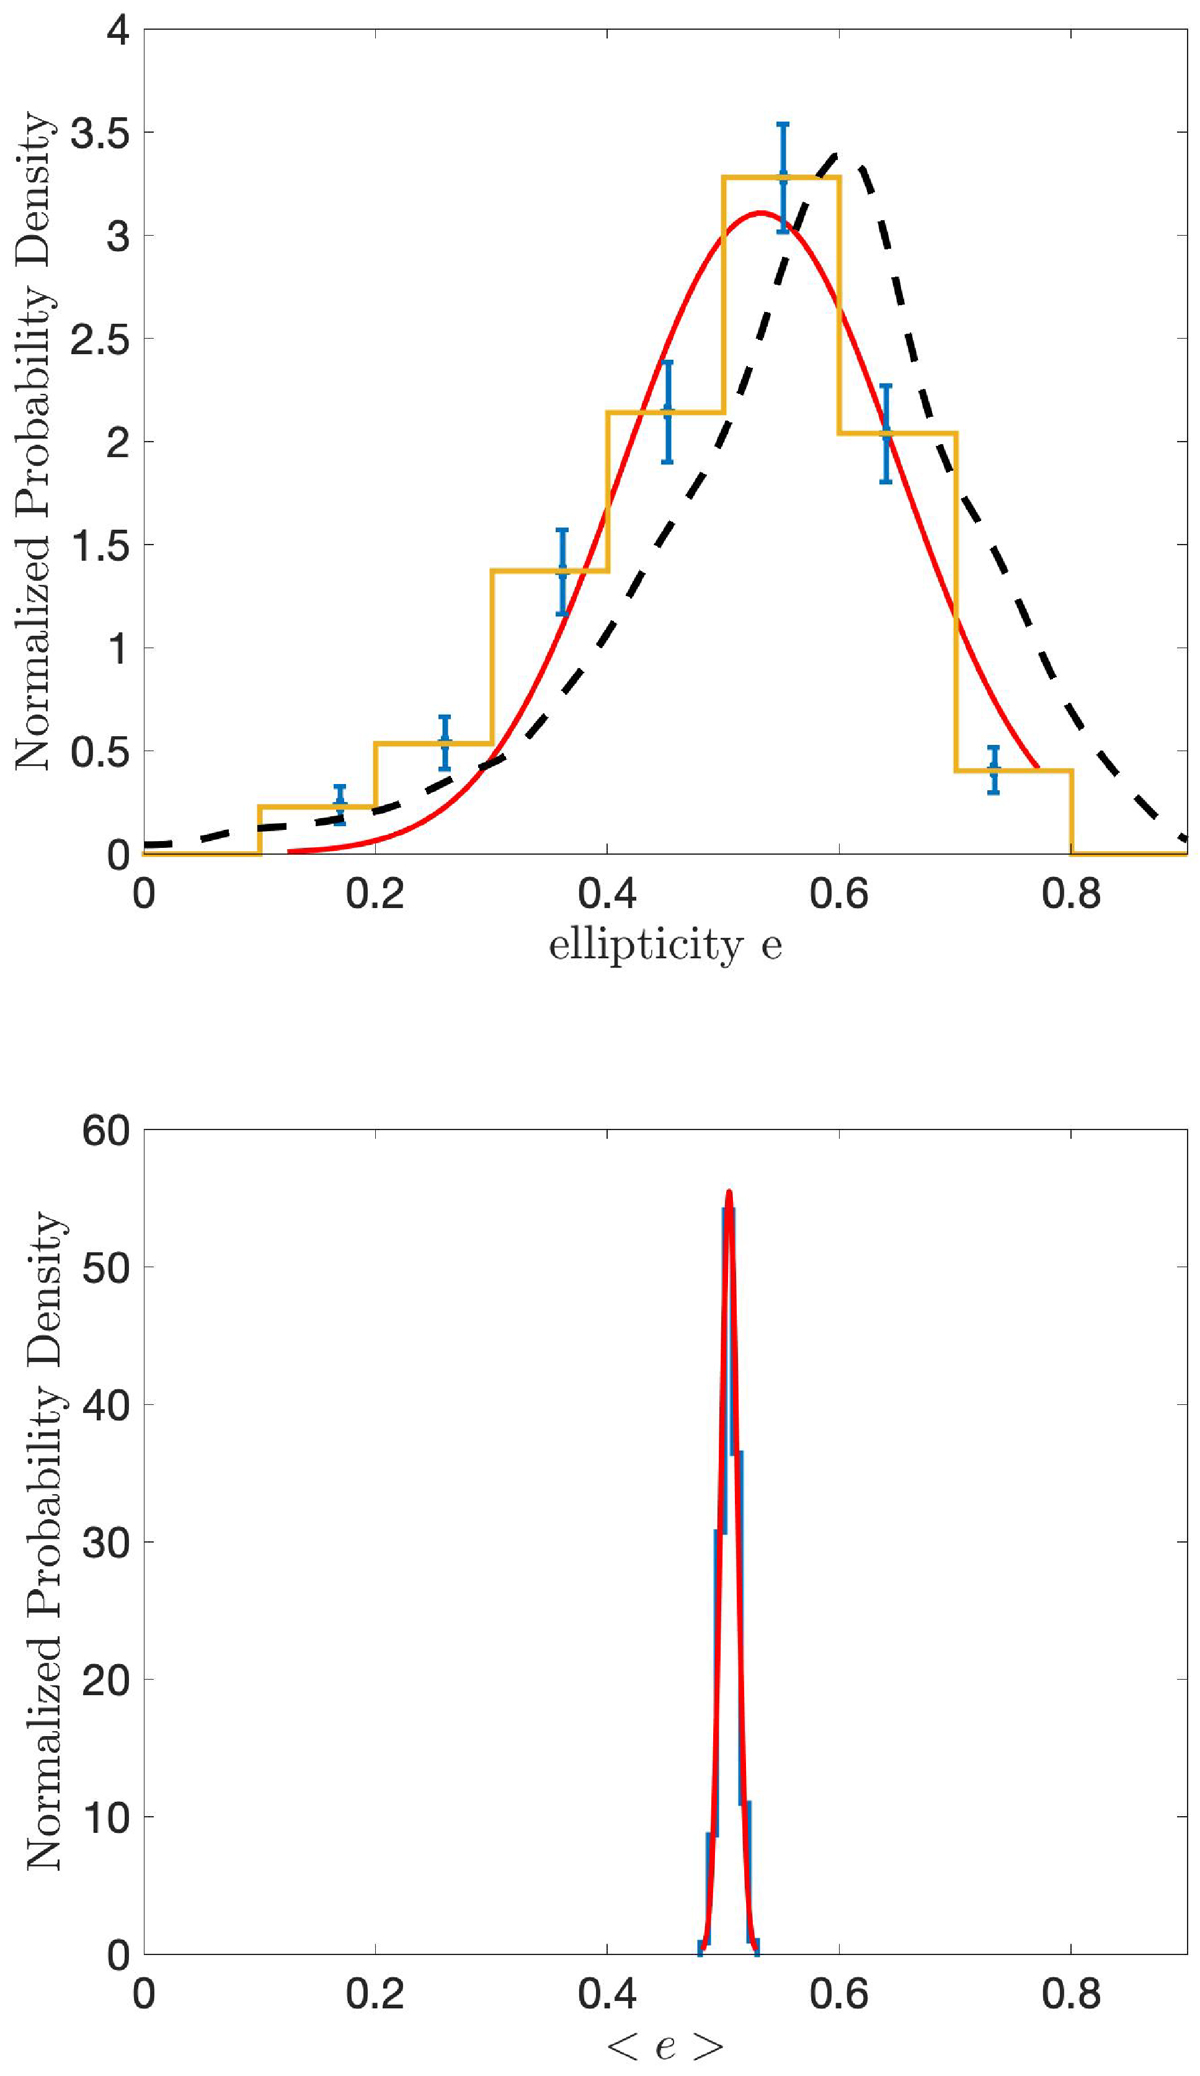
Upper panel: Probability distribution function (PDF) of the ellipticity values derived from individual shear map fittings of each cluster. Blue points represent the observed distribution, with error bars estimated from 1000 bootstrap resamplings. The red curve shows a Gaussian fit to the distribution, centered at e = 0.530 ± 0.168. For comparison, the dashed black line represents the ellipticity distribution reported by Liu et al. (2025), converted to match our ellipticity definition. Lower panel: PDF of the sample-averaged ellipticity, ⟨e⟩, computed from the full cluster ensemble. The red curve shows a Gaussian fit centered at ⟨e⟩ = 0.505 ± 0.007.
Current usage metrics show cumulative count of Article Views (full-text article views including HTML views, PDF and ePub downloads, according to the available data) and Abstracts Views on Vision4Press platform.
Data correspond to usage on the plateform after 2015. The current usage metrics is available 48-96 hours after online publication and is updated daily on week days.
Initial download of the metrics may take a while.