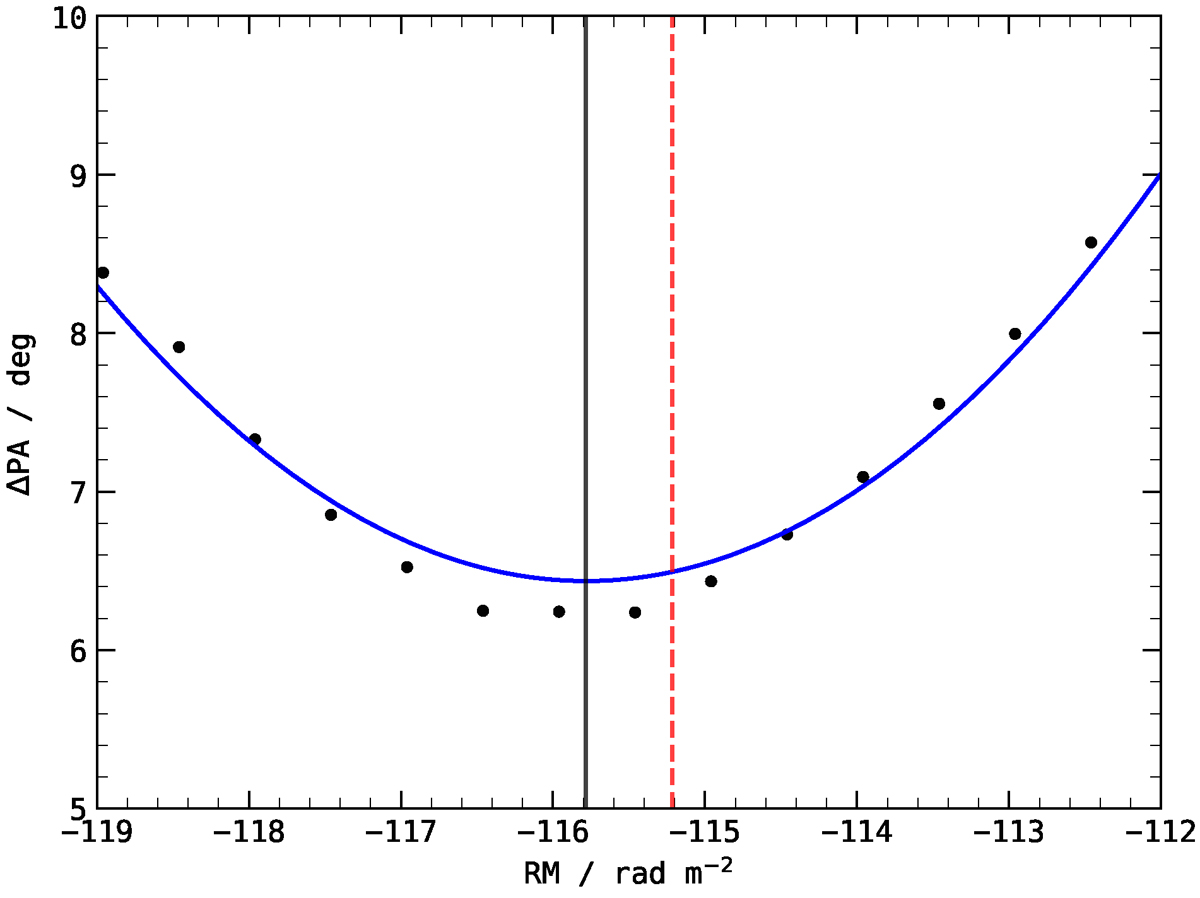
Fig. 1.
Download original image
Applying one RM to all the bursts detected during the observation of MJD 59243 and measuring the standard deviation of all the PA measurements from every time bin of every burst. Repeating this procedure for multiple RMs yields the black dots. The blue line is the fitted parabola. The vertical black line is the center of the fitted parabola. The red dashed vertical line is the RM measured after fitting using all the bursts. See Table 1 and Sect. 2.2.
Current usage metrics show cumulative count of Article Views (full-text article views including HTML views, PDF and ePub downloads, according to the available data) and Abstracts Views on Vision4Press platform.
Data correspond to usage on the plateform after 2015. The current usage metrics is available 48-96 hours after online publication and is updated daily on week days.
Initial download of the metrics may take a while.