Open Access
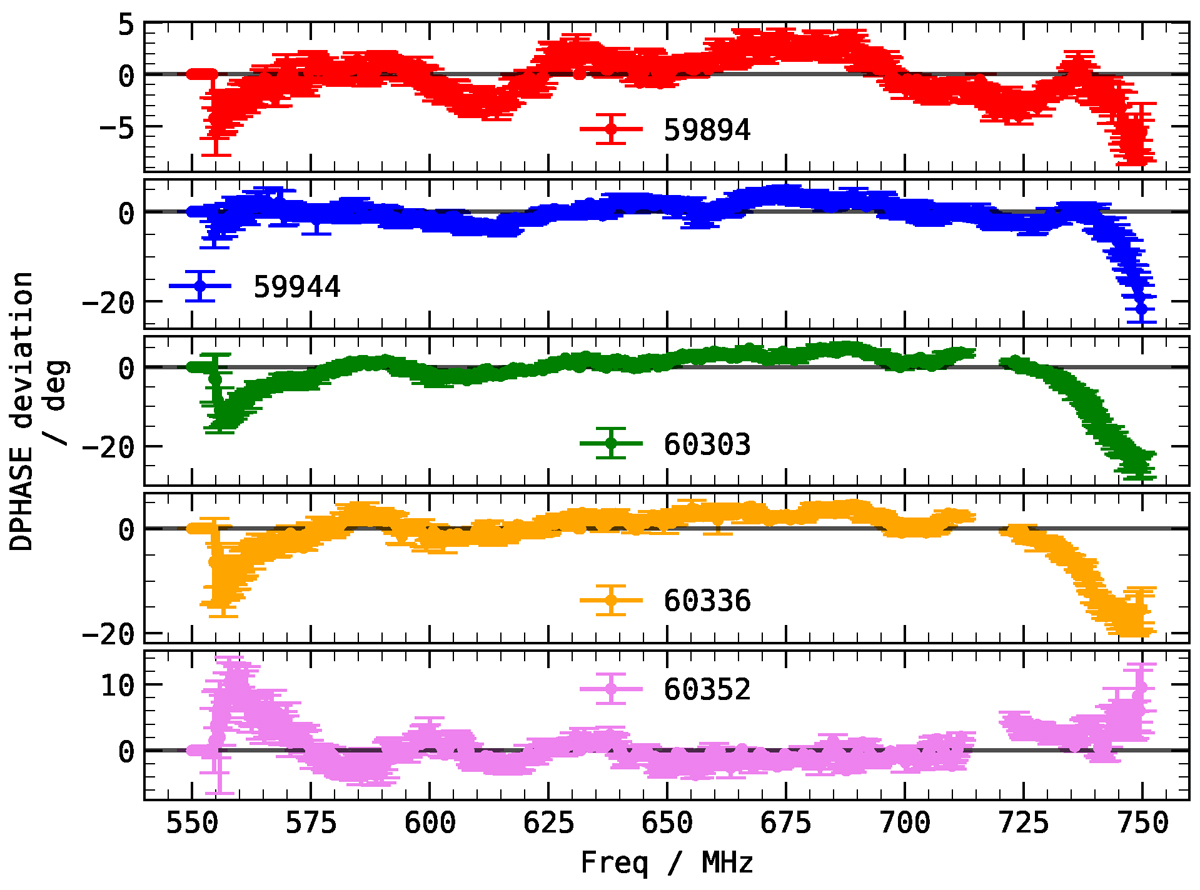
Fig. A.3.
Download original image
Deviations from linear DPHASE modeling shown against frequency using noise diode scans taken on different MJDs. Each panel shows deviation where each DPHASE fitted model is subtracted from the DPHASE data.
Current usage metrics show cumulative count of Article Views (full-text article views including HTML views, PDF and ePub downloads, according to the available data) and Abstracts Views on Vision4Press platform.
Data correspond to usage on the plateform after 2015. The current usage metrics is available 48-96 hours after online publication and is updated daily on week days.
Initial download of the metrics may take a while.