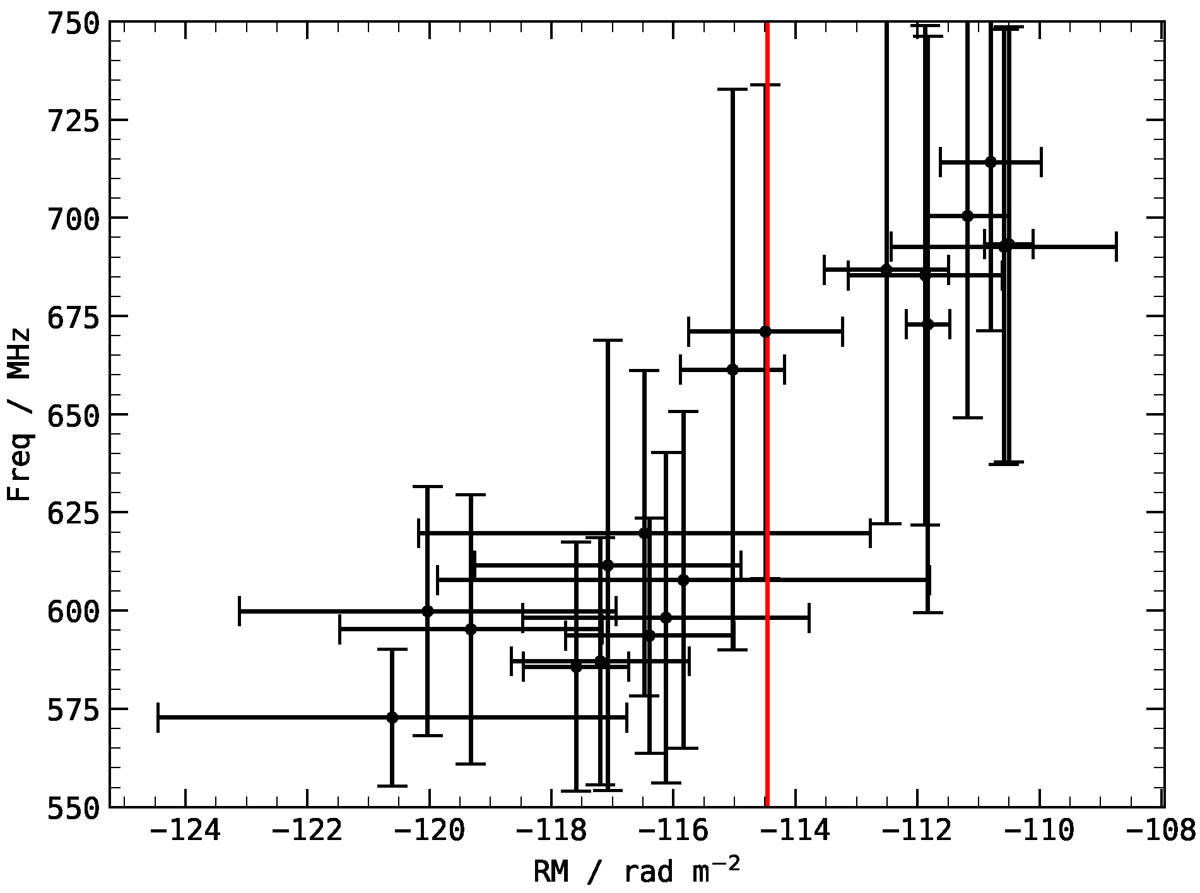
Fig. B.1.
Download original image
Bandwidth versus measured RM for a selection of bursts detected on MJD 59243. The bandwidth is shown as error in y-axis, while x-axis error refers to RM error. The red line is the inverse variance weighted RM average. Bursts have been selected such that they occupy around half of the entire observing band. The observed trend is non physical and caused by DPHASE deviations from the linear model used to calibrate. See Sect. 2.2.
Current usage metrics show cumulative count of Article Views (full-text article views including HTML views, PDF and ePub downloads, according to the available data) and Abstracts Views on Vision4Press platform.
Data correspond to usage on the plateform after 2015. The current usage metrics is available 48-96 hours after online publication and is updated daily on week days.
Initial download of the metrics may take a while.