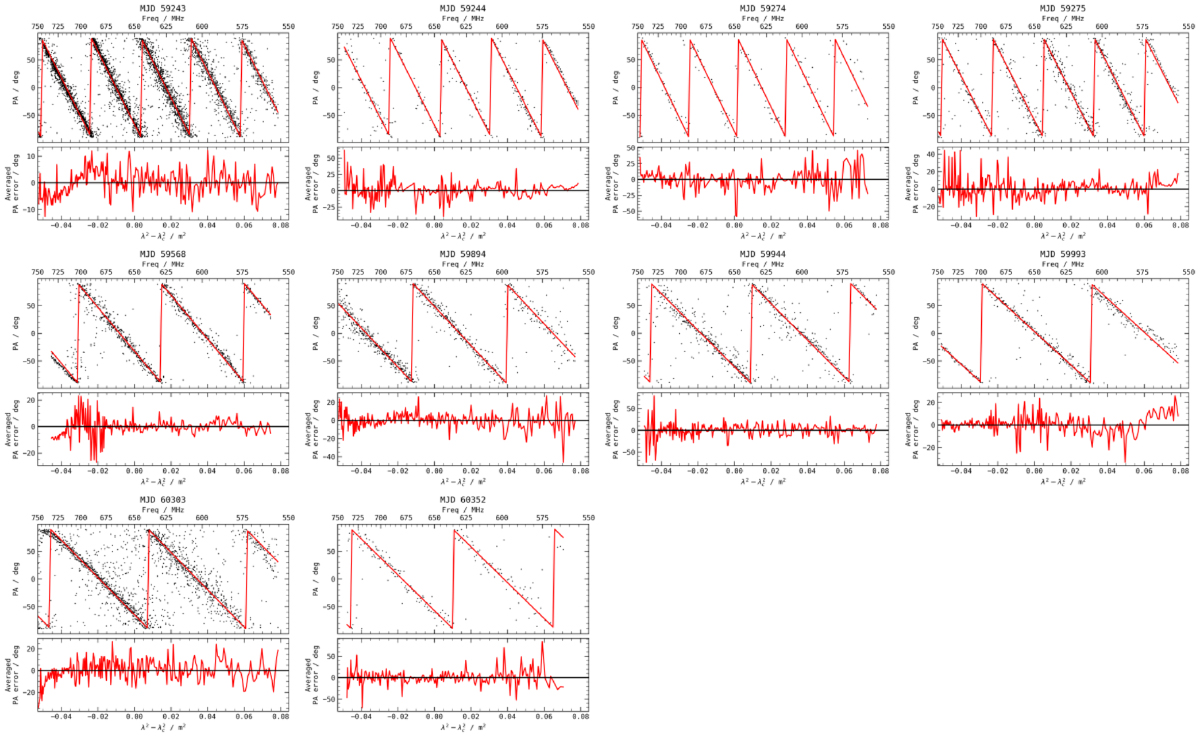
Fig. B.2.
Download original image
Outcomes of fitting one RM and one PA to all the bursts from an observation. Each plot corresponds to one observation. The top panels show PA against λ2 − λc2 where λc is the wavelength of the center frequency of the band. The individual data points are shown with black dots and the red line corresponds to the fitted model. The top x-axis shows frequency in MHz. The bottom panels show averaged error between data and fitted model. The horizontal black line is drawn at 0 deg.
Current usage metrics show cumulative count of Article Views (full-text article views including HTML views, PDF and ePub downloads, according to the available data) and Abstracts Views on Vision4Press platform.
Data correspond to usage on the plateform after 2015. The current usage metrics is available 48-96 hours after online publication and is updated daily on week days.
Initial download of the metrics may take a while.