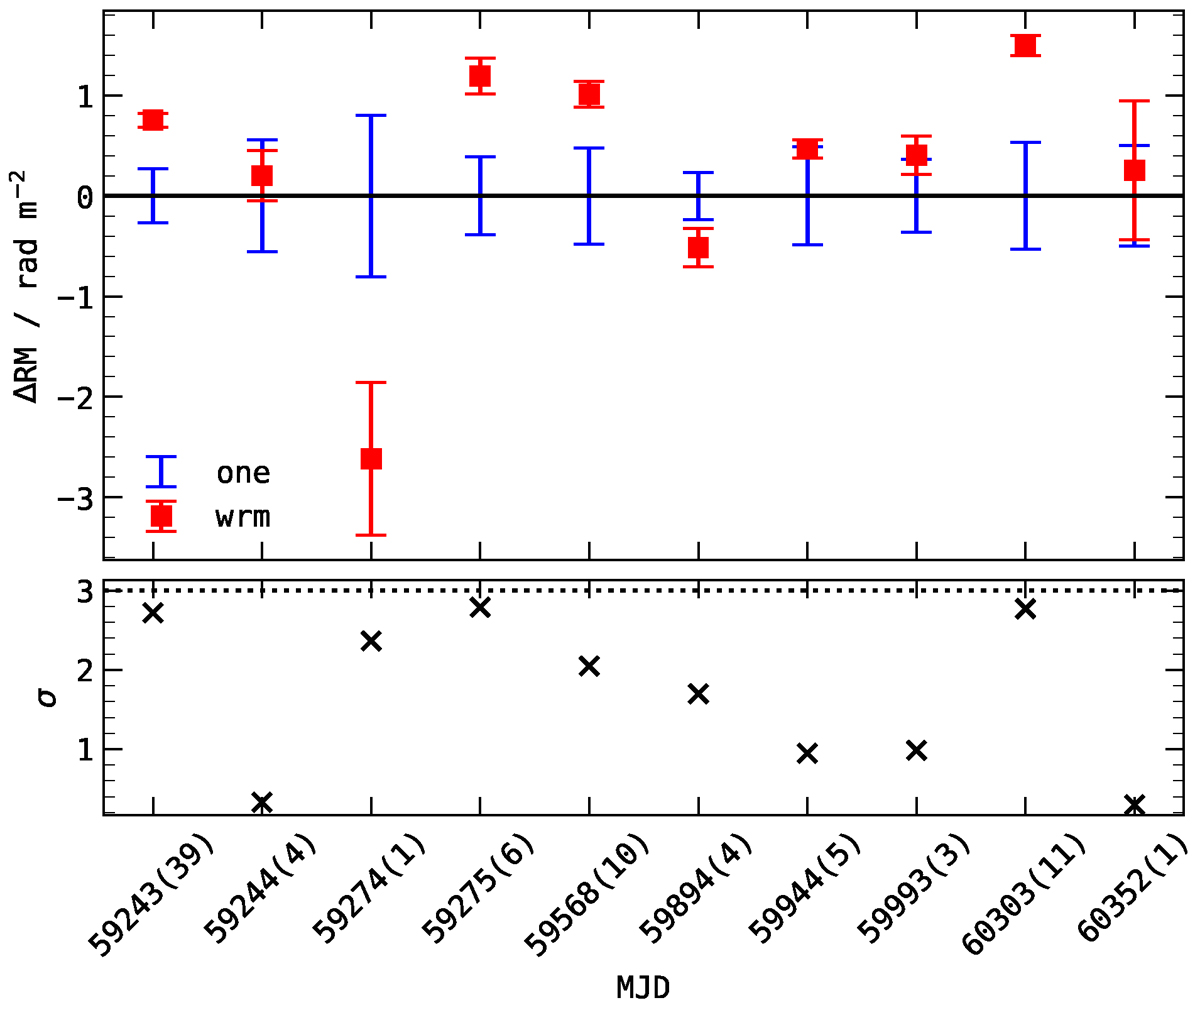
Fig. B.3.
Download original image
Difference between one RM fitted to all bursts in an observation (shown with one as legend) and the inverse variance weighted average of each individual QU-fitted RM measurements from each burst of the observation (shown with wrm as legend). The top panel only shows the difference with error-bars. The bottom panels shows the significance of difference. The horizontal black dotted line is drawn at 3σ. The number in parenthesis refers to the number of bursts detected in the respective MJD.
Current usage metrics show cumulative count of Article Views (full-text article views including HTML views, PDF and ePub downloads, according to the available data) and Abstracts Views on Vision4Press platform.
Data correspond to usage on the plateform after 2015. The current usage metrics is available 48-96 hours after online publication and is updated daily on week days.
Initial download of the metrics may take a while.