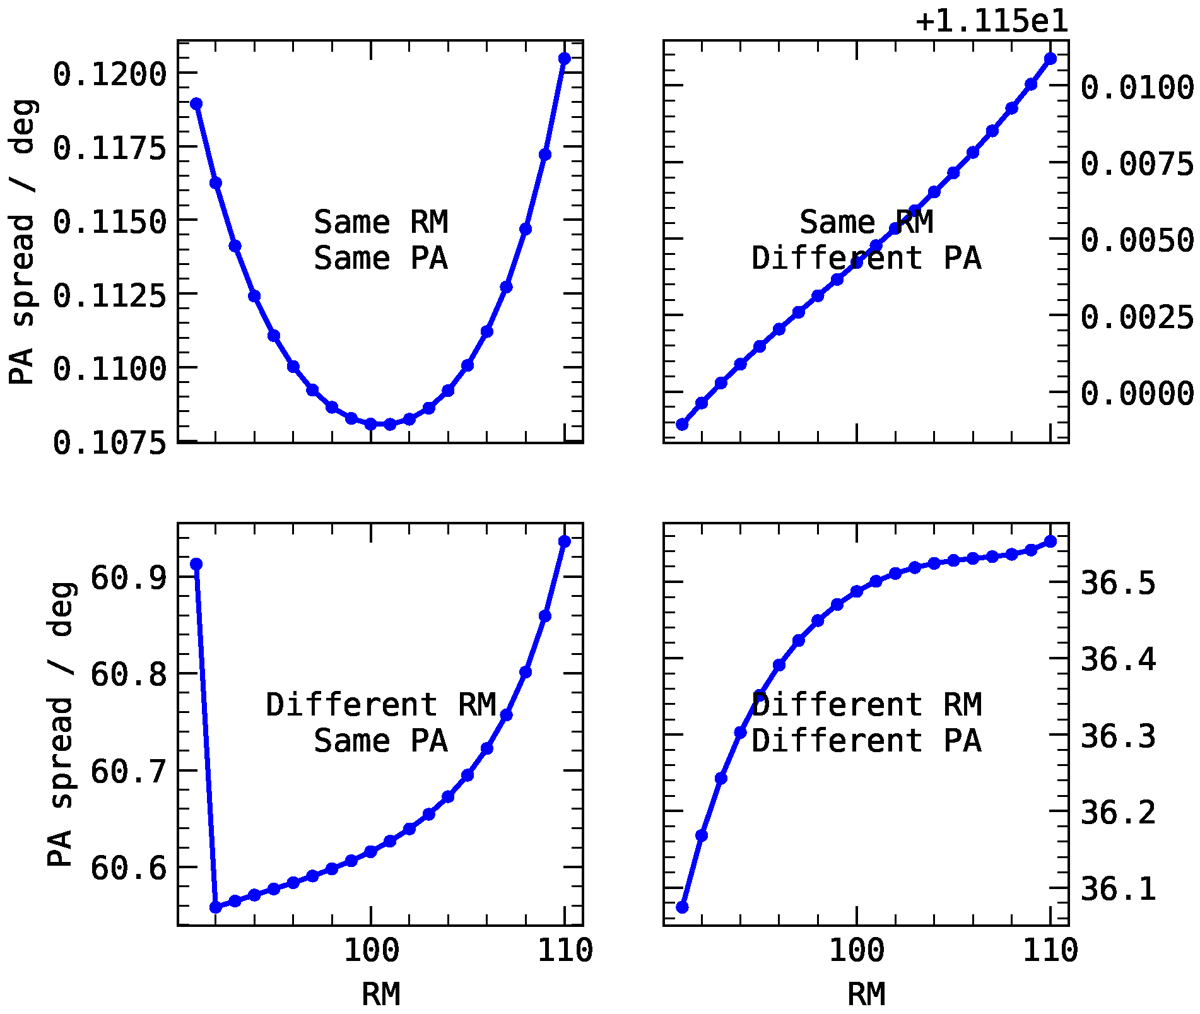
Fig. B.5.
Download original image
Showing by means of simulation that spread in PA is only minimized when bursts have a non-varying RM and PA. We simulated 15 bursts with same RM and same PA (top left), same RM but different PA (top right), different RM but same PA (bottom left), and different RM and different PA (bottom right). In each of the cases, we corrected for one RM and measured the spread in PA after correction, which is plotted with blue dots in each of the subplots. The spread in PA is greatly minimized and appears similar to a parabola only in the case of same RM and same PA.
Current usage metrics show cumulative count of Article Views (full-text article views including HTML views, PDF and ePub downloads, according to the available data) and Abstracts Views on Vision4Press platform.
Data correspond to usage on the plateform after 2015. The current usage metrics is available 48-96 hours after online publication and is updated daily on week days.
Initial download of the metrics may take a while.