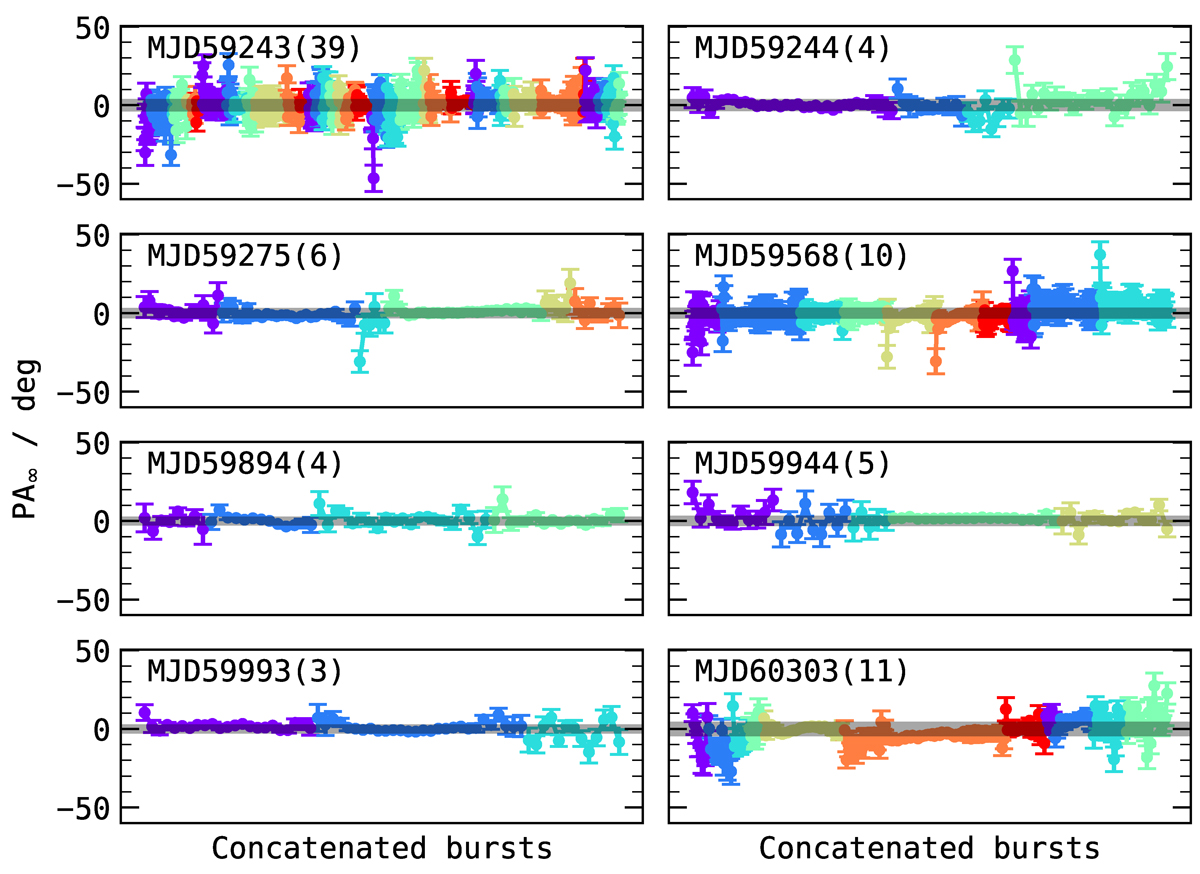
Fig. 2.
Download original image
PA∞ values of every time sample of each burst plotted one after the another in individual subplots for every MJD. Each PA∞ has been rotated by ⟨PA∞⟩ taken from Table 1. The different colors indicate different bursts. The shaded region around it is ΔPA, as reported in Tab. 1. The top left text in each subplot is the corresponding MJD and the number of bursts in parenthesis.
Current usage metrics show cumulative count of Article Views (full-text article views including HTML views, PDF and ePub downloads, according to the available data) and Abstracts Views on Vision4Press platform.
Data correspond to usage on the plateform after 2015. The current usage metrics is available 48-96 hours after online publication and is updated daily on week days.
Initial download of the metrics may take a while.