Fig. 5.
Download original image
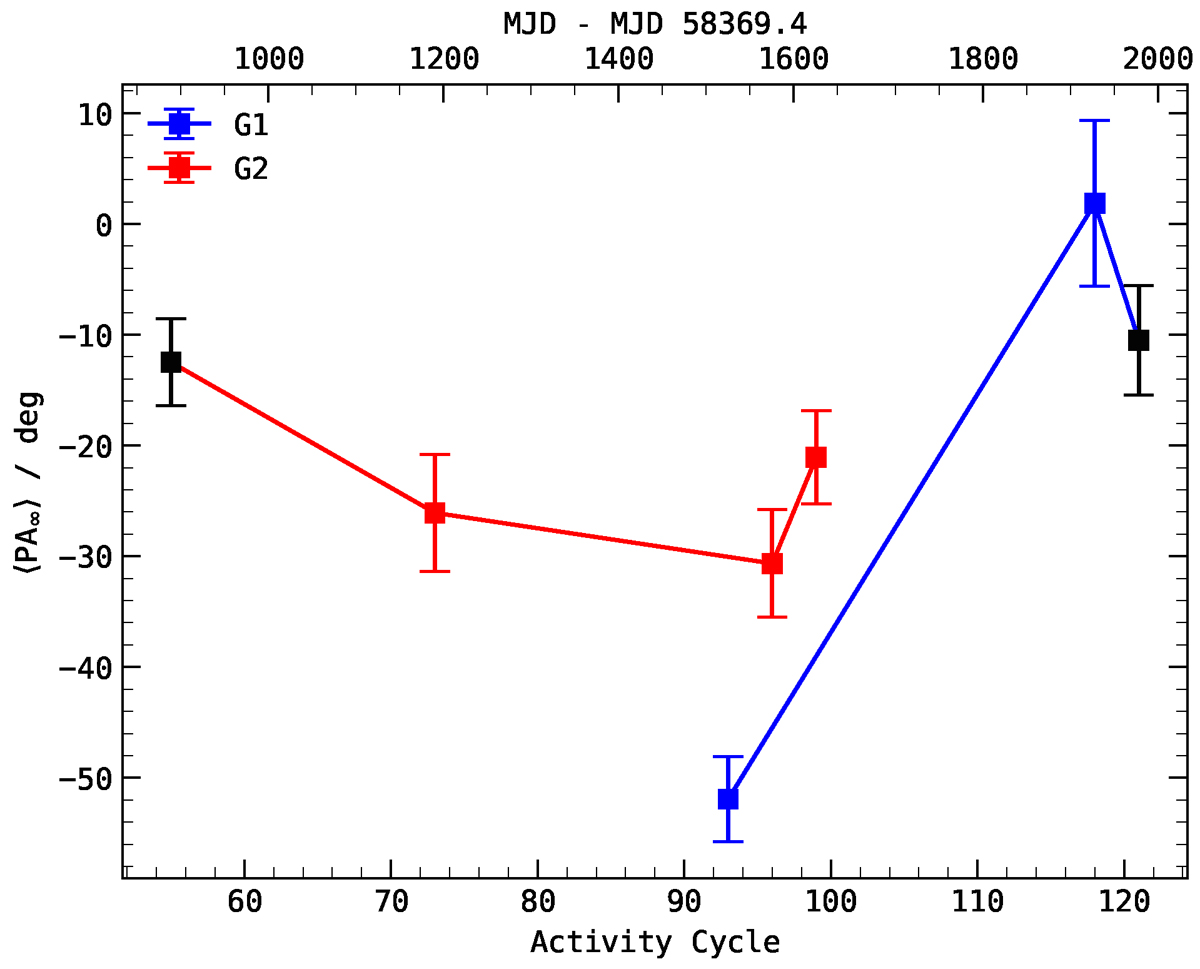
⟨PA∞⟩ versus activity cycle for the two phase clusters: G1 and G2. G1 refers to the ⟨PA∞⟩ measurements made at around Phase 0.359 (MJD 59894, 60303 and 60352) and G2 at around Phase 0.400 (MJD 59274, 59568, 59944, 59993). See Sect. 3.2. The black markers are used to denote those ⟨PA∞⟩ measurements with only one burst. The top x-axis shows MJD of the ⟨PA∞⟩ measurements. We emphasize that the reference MJD of the top x-axis is that of the periodicity model of FRB 20180916B.
Current usage metrics show cumulative count of Article Views (full-text article views including HTML views, PDF and ePub downloads, according to the available data) and Abstracts Views on Vision4Press platform.
Data correspond to usage on the plateform after 2015. The current usage metrics is available 48-96 hours after online publication and is updated daily on week days.
Initial download of the metrics may take a while.