Open Access
Fig. 7.
Download original image
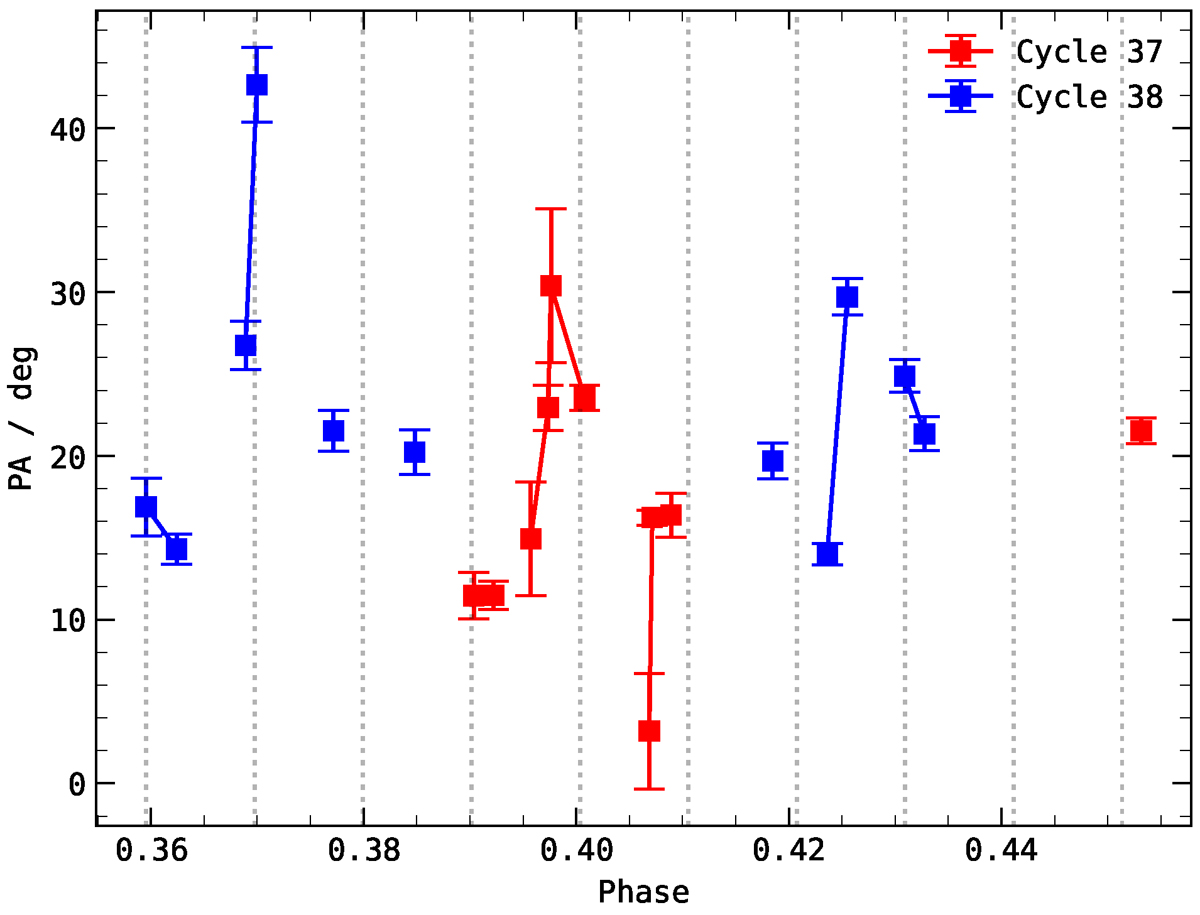
Position angle measurements of bursts detected by APERTIF at 1370 MHz in activity cycle-37 and -38 (Pastor-Marazuela et al. 2021). Line connecting squares denotes measurements taken in the same observing session. The black dotted line is drawn for every four hours of phase-separation.
Current usage metrics show cumulative count of Article Views (full-text article views including HTML views, PDF and ePub downloads, according to the available data) and Abstracts Views on Vision4Press platform.
Data correspond to usage on the plateform after 2015. The current usage metrics is available 48-96 hours after online publication and is updated daily on week days.
Initial download of the metrics may take a while.