Fig. A.1.
Download original image
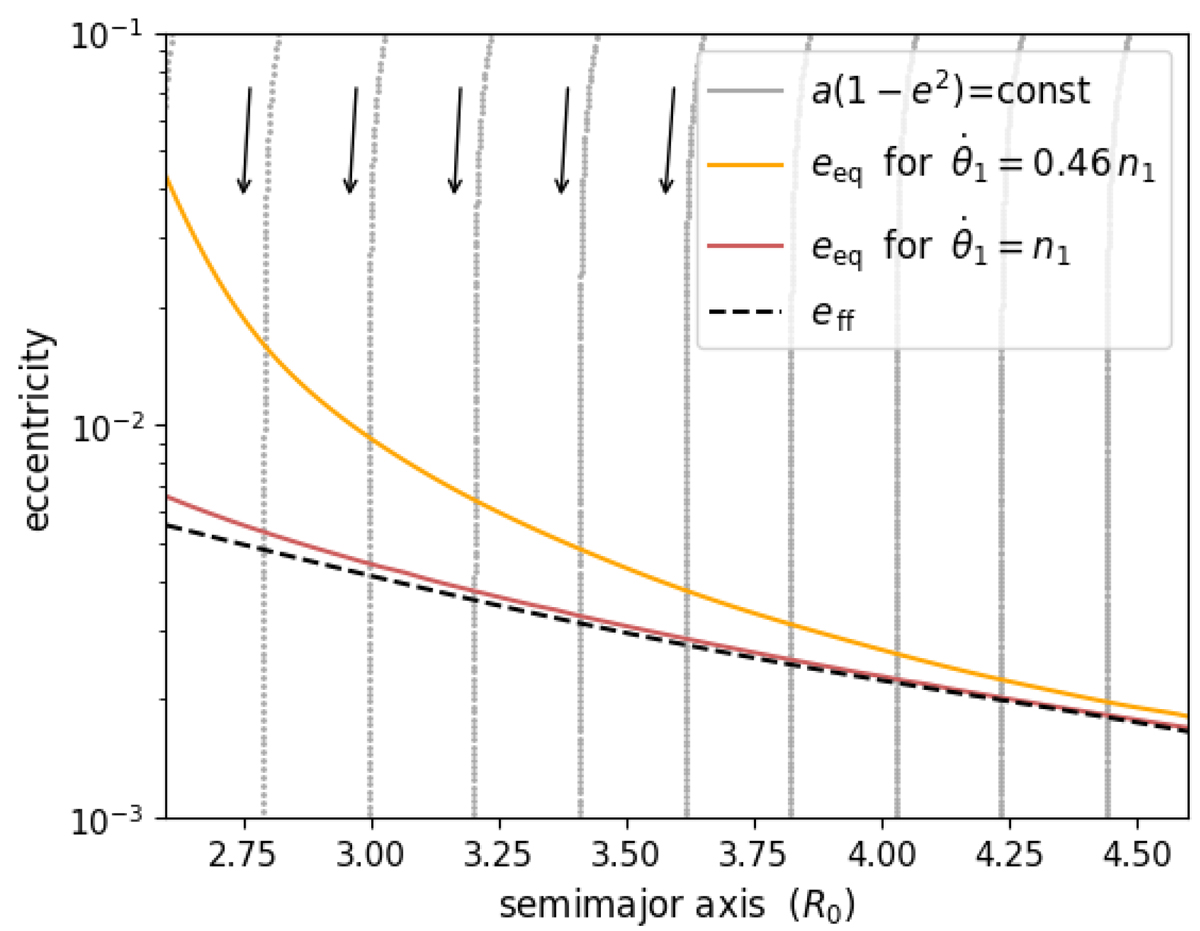
Schematic view of the different interactions acting on the initial particle disk. Curves of constant angular momentum (per unit mass) are shown in gray, with arrows indicating evolutionary routes due to a radial drag term. Red and orange curves highlight the equilibrium eccentricities of initial conditions undergoing both collisions and gravitational perturbations (assuming μ = 0.05 and R0 = 115 km). Both differ in the assumed angular frequency ![]() of M1 around the center of mass of Mc. The red curve shows results assuming
of M1 around the center of mass of Mc. The red curve shows results assuming ![]() equal to the keplerian mean-motion (n1). Conversely, the orange curve was calculated considering a sub-keplerian orbital frequency equal to the spin rate of M0, i.e.
equal to the keplerian mean-motion (n1). Conversely, the orange curve was calculated considering a sub-keplerian orbital frequency equal to the spin rate of M0, i.e. ![]() . For comparison, the black dashed curve shows the semi-secular equilibrium eccentricity eff, as given by equation (A.1).
. For comparison, the black dashed curve shows the semi-secular equilibrium eccentricity eff, as given by equation (A.1).
Current usage metrics show cumulative count of Article Views (full-text article views including HTML views, PDF and ePub downloads, according to the available data) and Abstracts Views on Vision4Press platform.
Data correspond to usage on the plateform after 2015. The current usage metrics is available 48-96 hours after online publication and is updated daily on week days.
Initial download of the metrics may take a while.